|
3 |
Click Publish. |
|
2 |
Expand Other Actions. |
|
3 |
Click Create dashboard. |
|
4 |
|
5 |
On the View Properties screen, specify a name for the new dashboard. Select other dashboard elements or accept the defaults. |
|
6 |
On the Select Dashboard Layout screen, select a layout. |
|
7 |
Click Finish. |
|
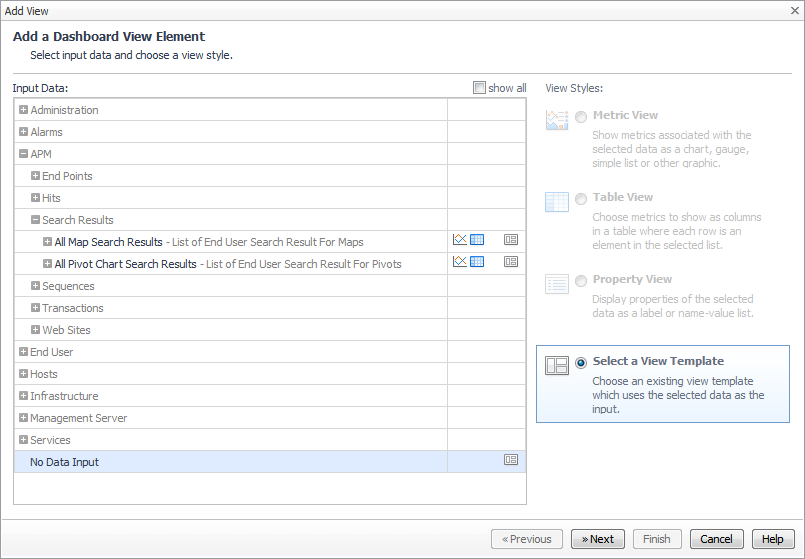
8 |
On the Add a Dashboard View Element screen, expand APM > Search Results, and then expand either All Map Search Results or All Pivot Chart Search Results. Select the map or pivot you want to add to the custom dashboard. |
|
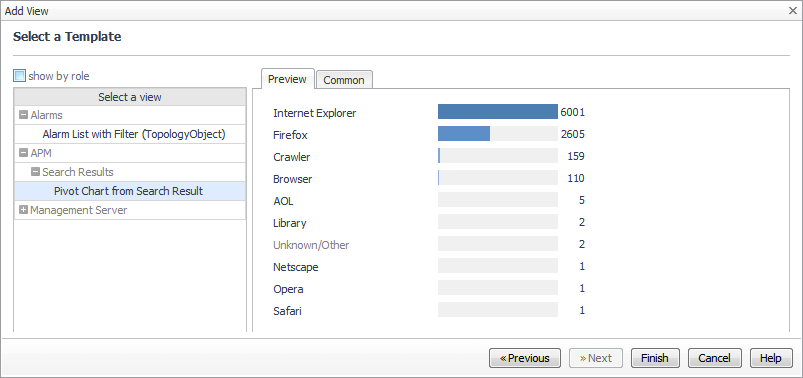
9 |
On the Select a Template screen, deselect show by role, and then expand APM > Search Results. Select the map or chart to display. |
|
10 |
Click Finish. |
|
2 |
Expand Actions. |
|
3 |
Click Manage Custom Dashboards. |
|
• |
