Farm administrators can view information about the health and storage utilization of their Metalogix StoragePoint implementation.
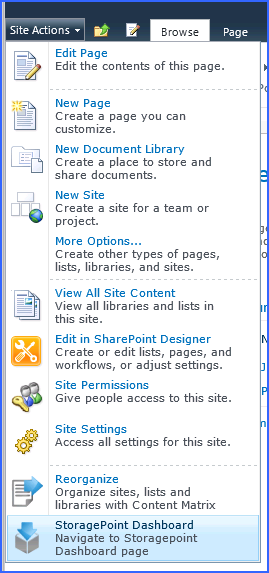
The Dashboard can be accessed from the StoragePoint Menu on the Application Management page. It can also be accessed from the site collection by the link found in the Site Actions menu.
|
|
NOTE: Accessing the dashboard from a Site Collection will only provide Profile and Endpoint information for the profile covering the scope of that site collection. |
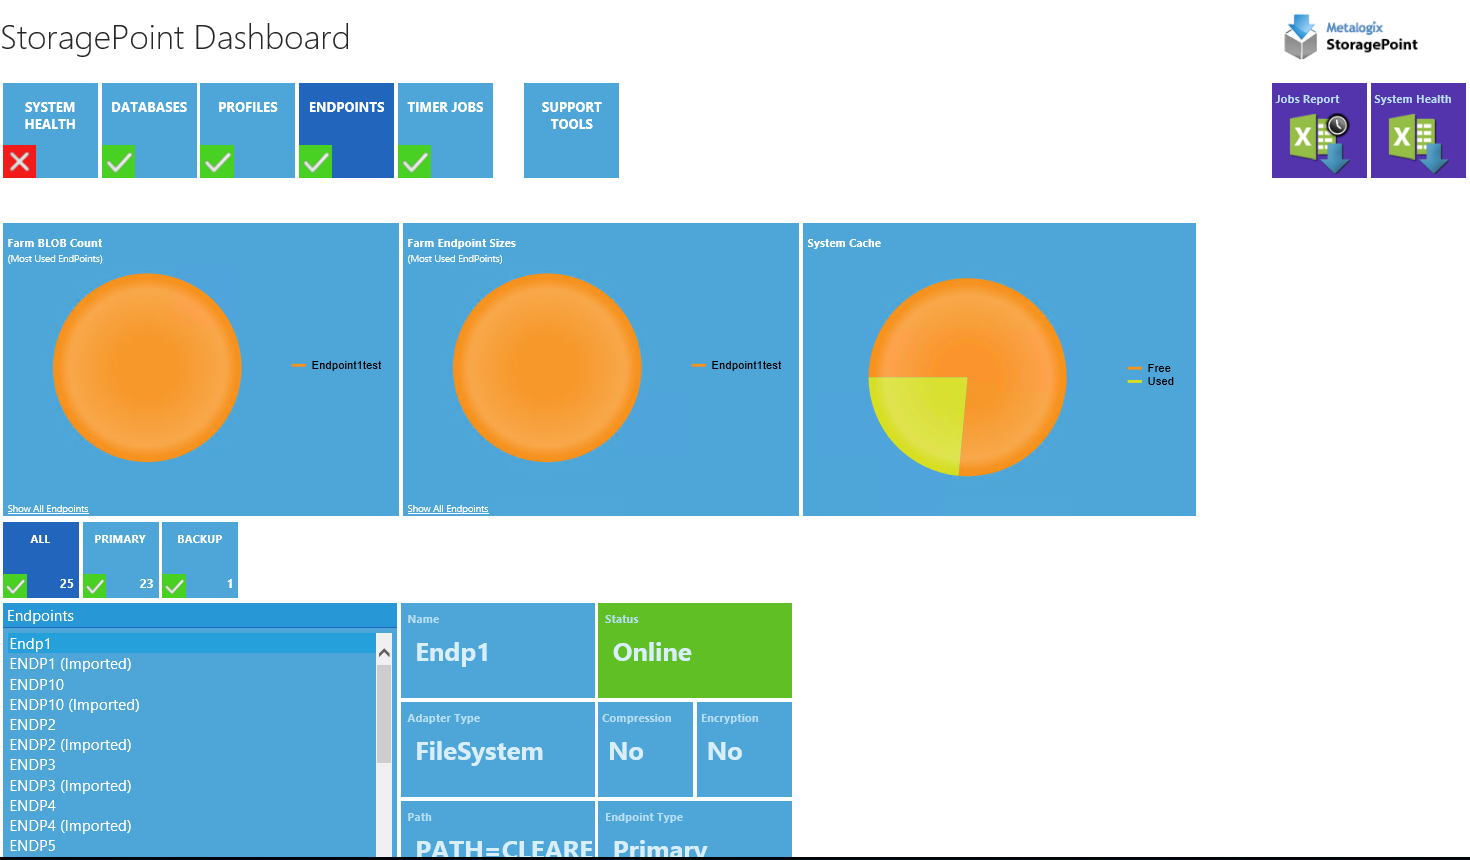
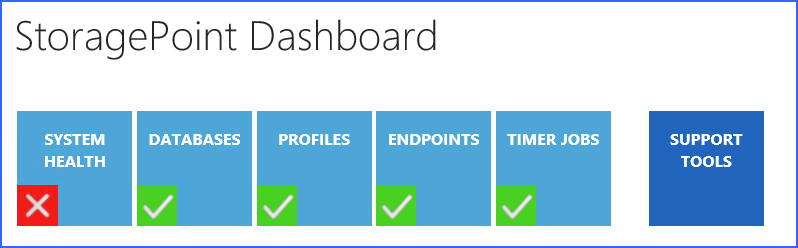
There are five main sections to the dashboard: System Health, Databases, Profiles, Endpoints and Timer Jobs. Support Tools is a BLOB ID decoder. Click the tile of each of these sections to see the relevant information displayed below.
The Jobs Report is covered below, and System Health Report works the same as the utility on General Settings.
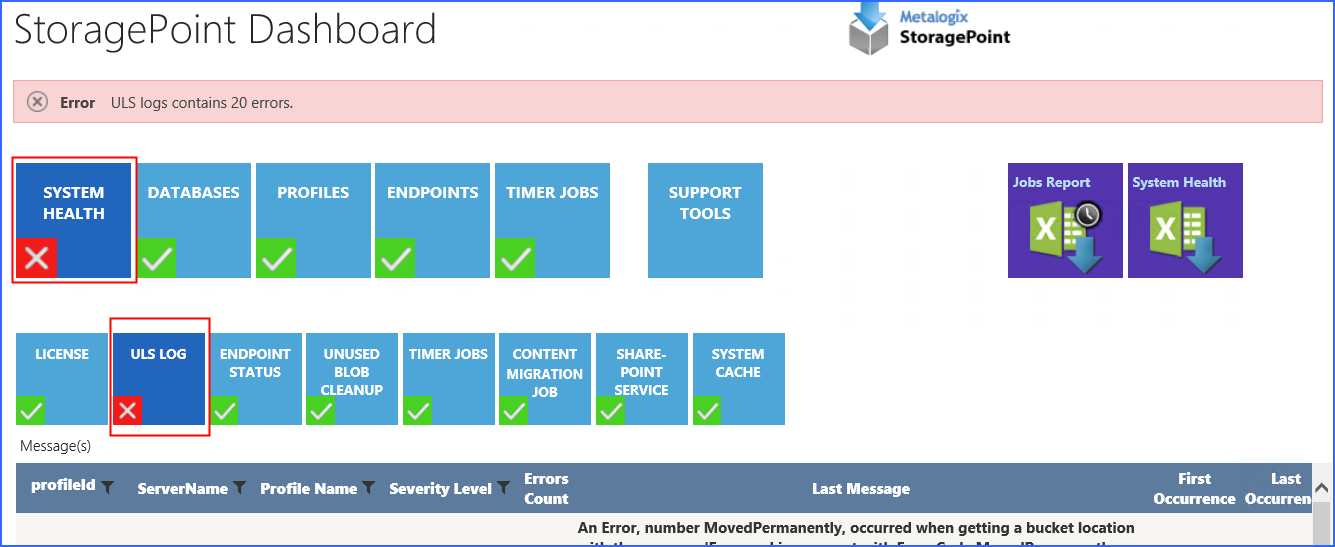
System Health will show the overall performance information, along with the status of some critical timer jobs. Each of the sub-tiles can be selected to display a status message along with a link to the page where more information can be found.
The ULS Logs link will indicate what errors are appearing in the ULS logs. These errors can be cleared from the dashboard using the Clear All links at the bottom of the page, but will remain in the logs.
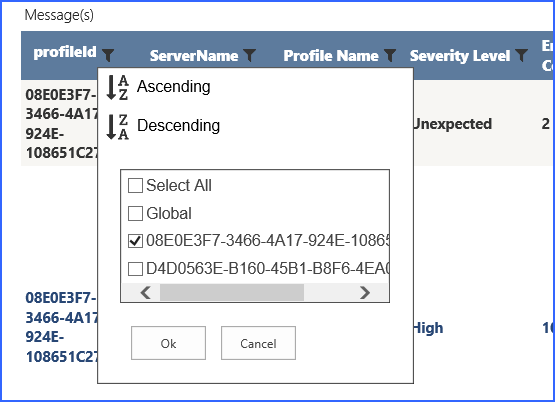
Use the filter buttons to organize the messages by Profile ID, Server Name, Profile Name or Severity Level.
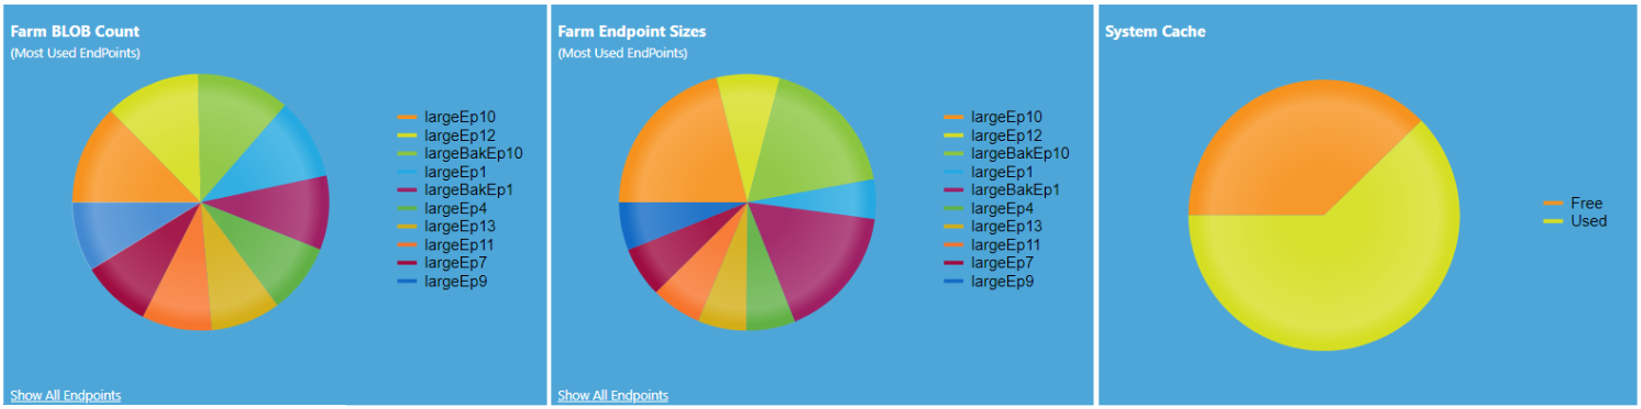
The System Cache dashboard link will show whether the system cache is reaching a threshold, and advise steps to correct it, namely running the StoragePoint BLOB Health Analyzer for each profile, and the Content Migrator job.
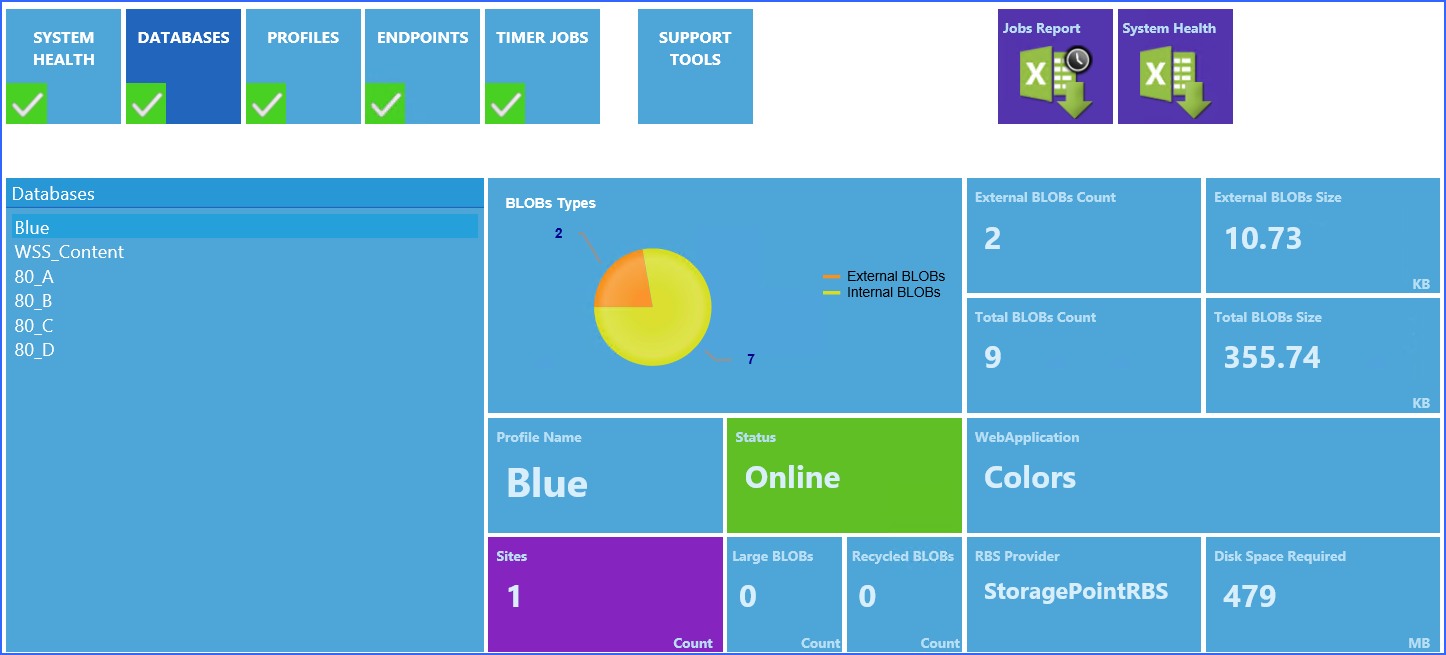
The Databases page shows all of the content databases in the SharePoint farm. Clicking the name of the database in the left column refreshes the data in the tiles to the right. If the tiles are not refreshing, security may have timed out: try refreshing the whole page.
Note that administrators can see the breakdown of internal and external BLOBs, and see in Disk Space Required, how much space is needed on an endpoint, at this point in time. Profile Name will say No Profile if the content database is not in a profile scope.
The Profiles page shows the configuration information for the StoragePoint profiles. The sub-tiles on this page can be used to filter the profiles if there are a large number of them configured for the farm. Select the name of the profile from the column on the left, and the graphs and fields will update accordingly. The expanding sections at the bottom also contain more information about the profile, such as which endpoints are storing BLOBs for the profile.
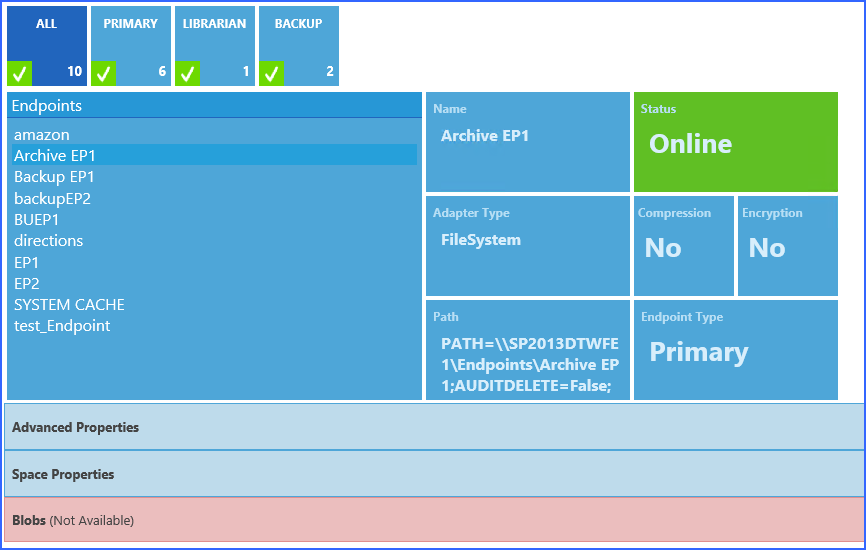
The Endpoints page opens with graphs that show information for all endpoints. Clicking the name of an endpoint will toggle the information between appearing or not, in the graph.
If 10 or more profiles have been created, click on the 'Show All Endpoints' link to show each Endpoint and their respective externalized Blobs.
The sub-tiles can be used as filters if there are a large number of endpoints in the StoragePoint configuration.
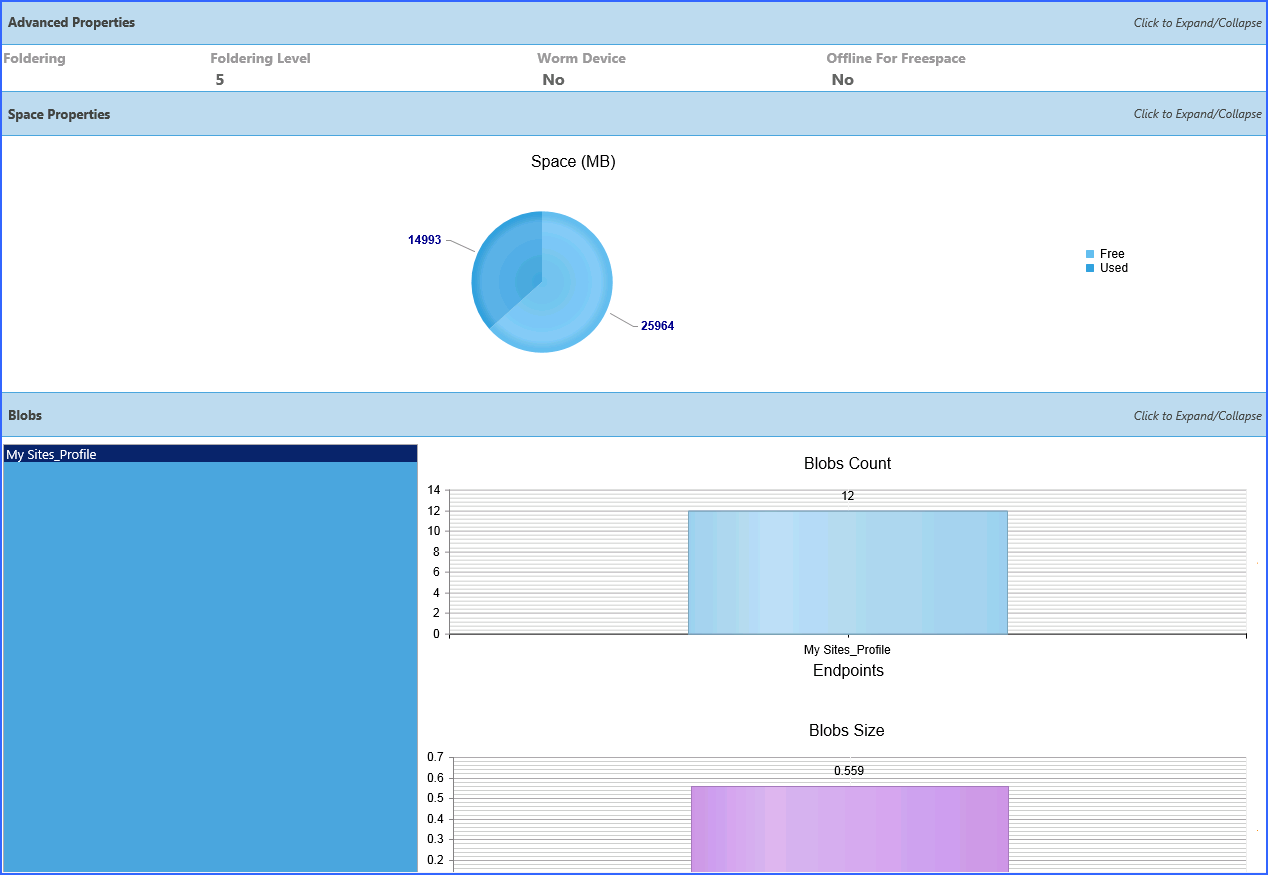
The expanding sections at the bottom contain more detailed information about each endpoint, included which profiles are using them. (If there is no information in the Space Properties, that endpoint cannot be monitored for free space.)
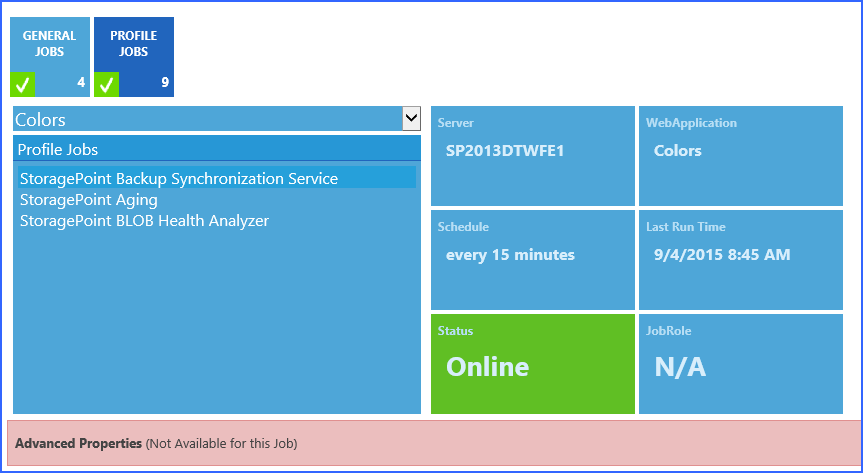
The Timer Jobs page shows the configuration options for both farm wide and profile specific timer jobs. Use the sub-tiles to select which to view. In the profile jobs page, select a profile to see which timer jobs are configured, and how, for that profile.
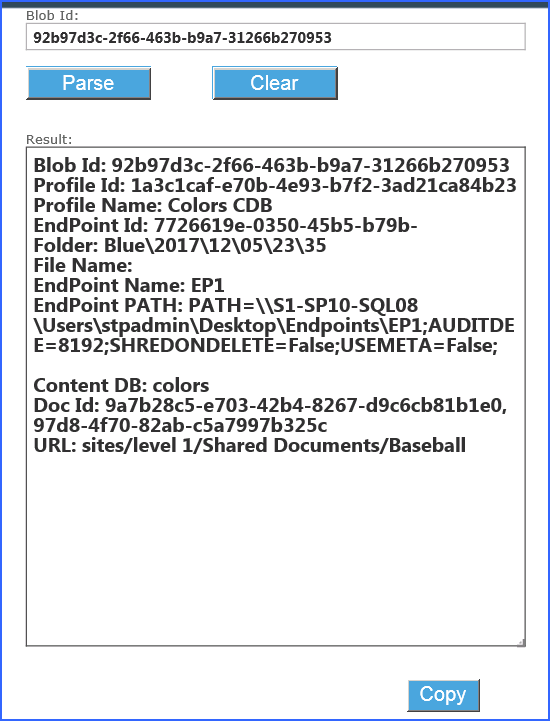
The BLOB ID Decoder is used to return information about a BLOB. For example, a timer job may say it can't find a BLOB. This tool will help identify where in the SharePoint farm that BLOB is in use.
Click Support Tools on the dashboard.
When the window refreshes, paste or type in a BLOB Id and click Parse.
The results will help to identify where the file can be found within the SharePoint farm.
Use the Clear button to clear the search results.
Use the Copy button to copy the search results to the clipboard.
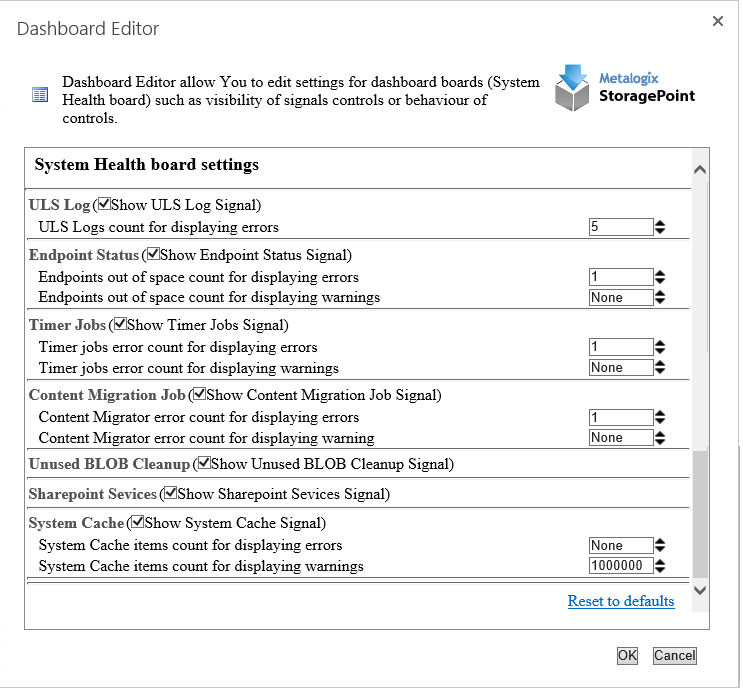
The System Health report can be modified to represent the notification levels that reflect thresholds deemed acceptable.
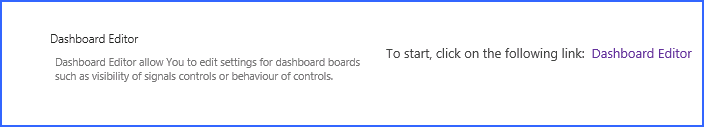
Go to the General Settings page and click Dashboard Editor in the Utilities section..
The threshold represents the point at which the notifications become more urgent. For example, if the threshold is 5 for displaying errors, and 1 for displaying a warning, the alert will show as an Error on the ULS information. All errors and warnings can be displayed, but the threshold lets an organization decide at what level it becomes more urgent. If there are between 1 and 4 errors, the alert will show as a Warning.
·Uncheck the boxes to remove a Signal from the System Health dashboard.
·Use the arrows to go up or down by 10, or type a threshold in manually.
Click OK. This will save the Dashboard settings, or click Save on General Settings to exit the General Settings page.
On the dashboard, the selections will be reflected in the amount of data provided.
Example: