Count View
How Do I Create a Counts View?
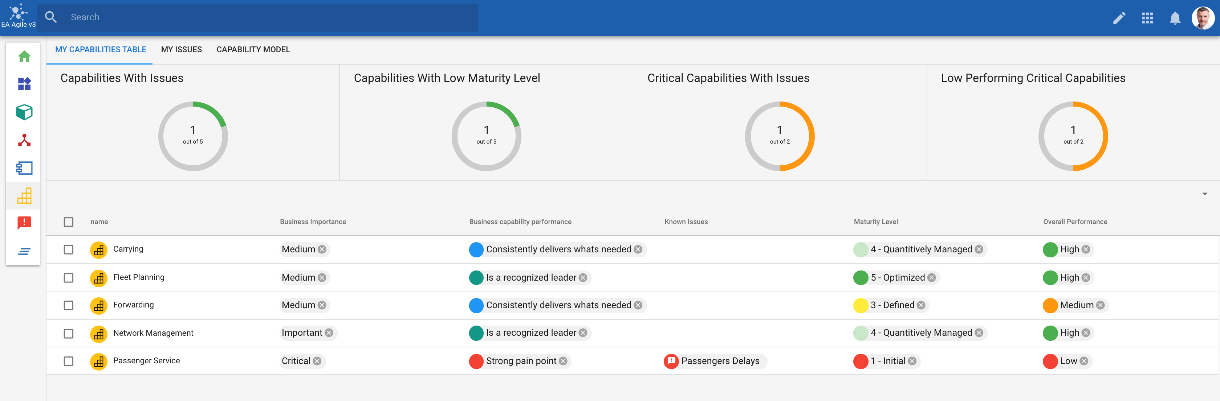
An example of count views being used in a dashboard layout. Count Views can be defined using filters.
|
|
Before starting you must read and follow the instructions in the New View help page. |
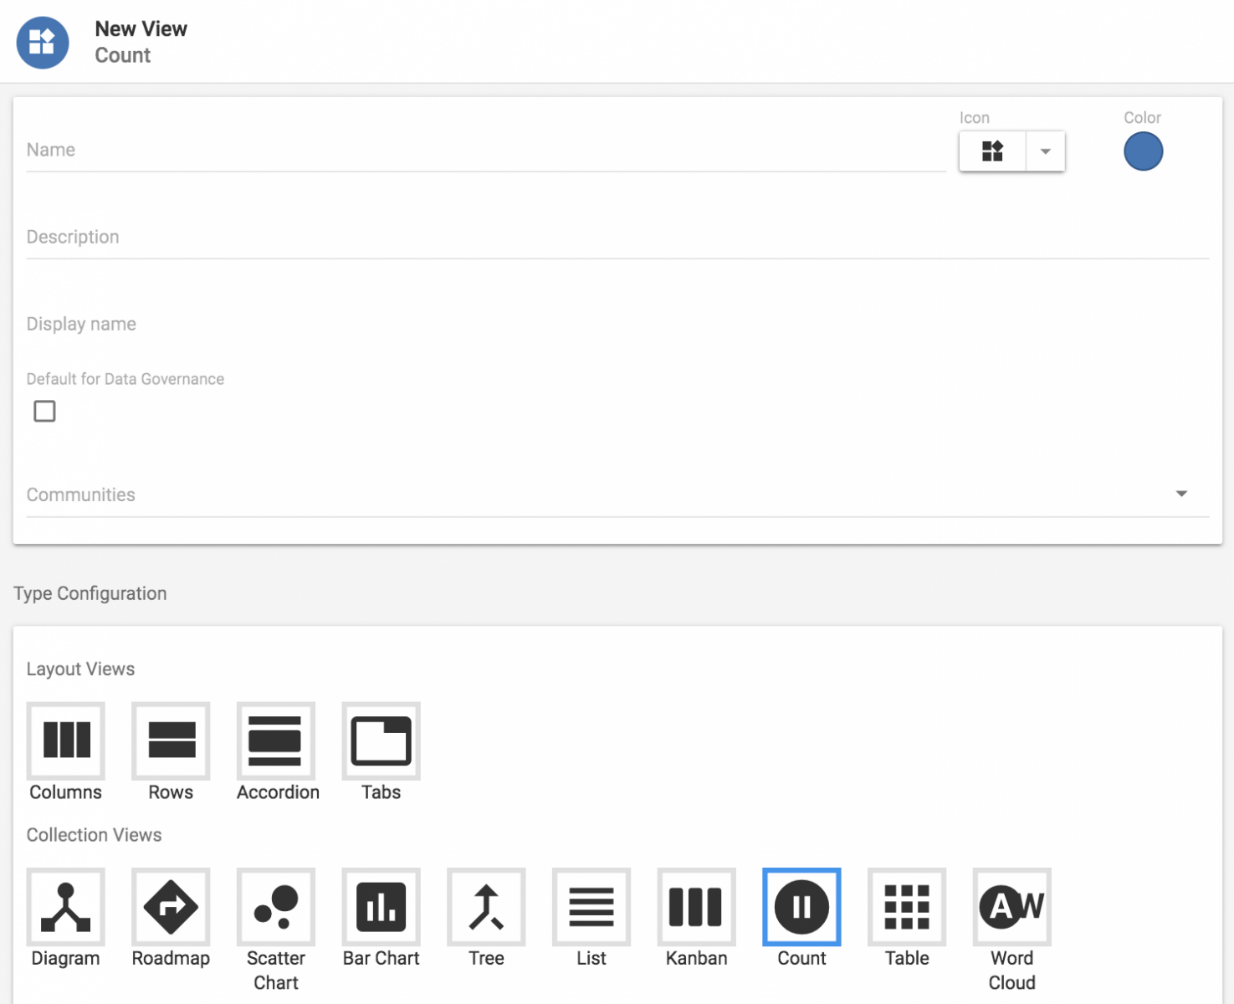
1.Select 'Count' from Collection Views
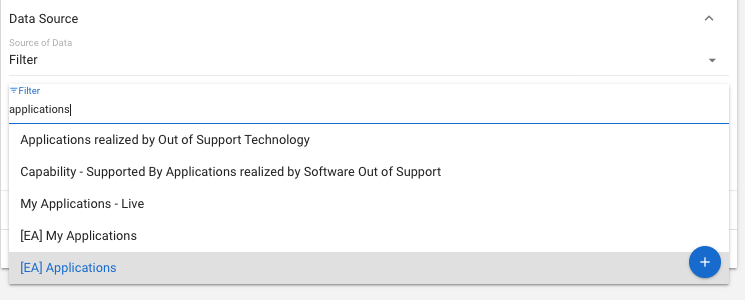
2. Add a Filter for the Object Type Instances you wish to count. You can either select a filter or create a new one (For more on how to create a filter, please visit the Filters help file)
|
|
Before starting you must read and follow the instructions in the New View help page. |
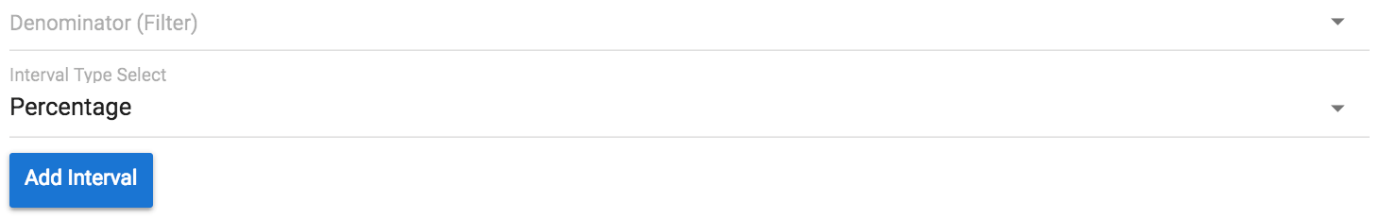
3. You can either set to display your Count as an Absolute or a Fraction (labeled Percentage). This is selected in the Interval Type Select menu
4. If you wish to display your Count as an absolute leave the Denominator (Filter) blank
If you wish to display it with a Denominator choose or create a Filter
5. You can also set Intervals to change the color of your Count and display an Icon when it hits a Value
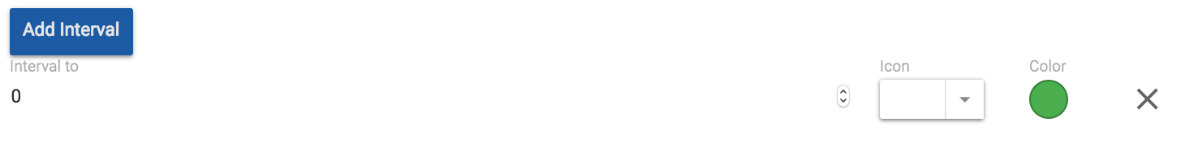
i.Click 'Add Interval'
ii.Select your Interval Type, you can choose to have Intervals at an Absolute value or a Percent value
iii.This will bring up a blank Interval to form
i❖.Set the Value, Icon & Color for your Interval
❖.If you wish to add another Interval click 'Add Interval'
6. Once you have finished click ‘Save’ in the bottom right corner.
Tree View
How Do I Create a Tree View?
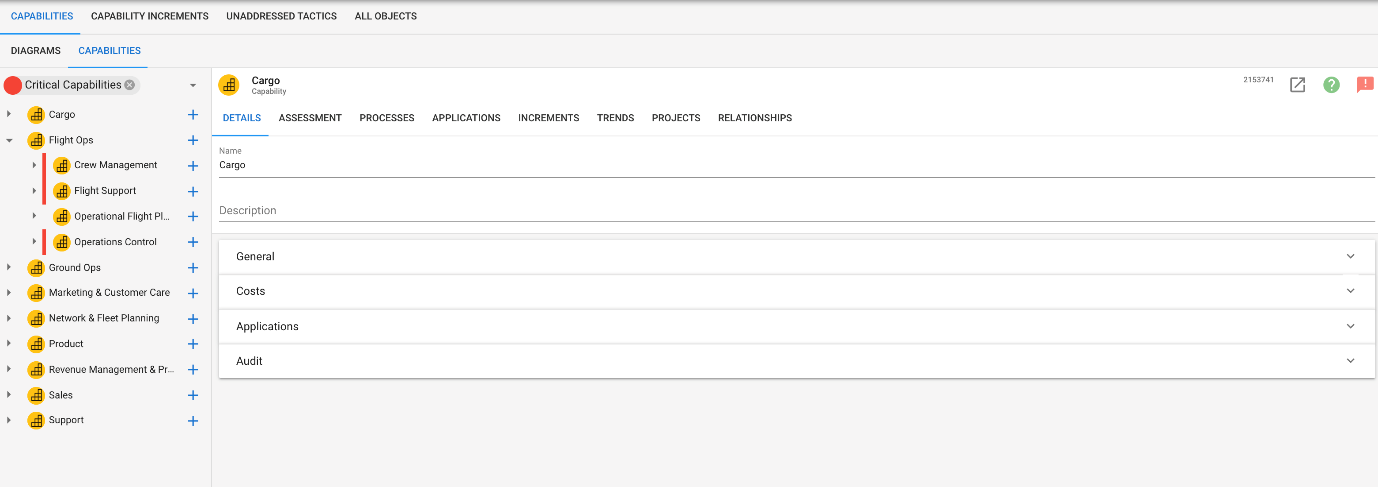
Tree Views are used to visualize data hierarchically with each branch showing an objects related items. The example below shows sub-capabilities as a branch of a parent capability.
|
|
Before starting you must read and follow the instructions in the New View help page. |
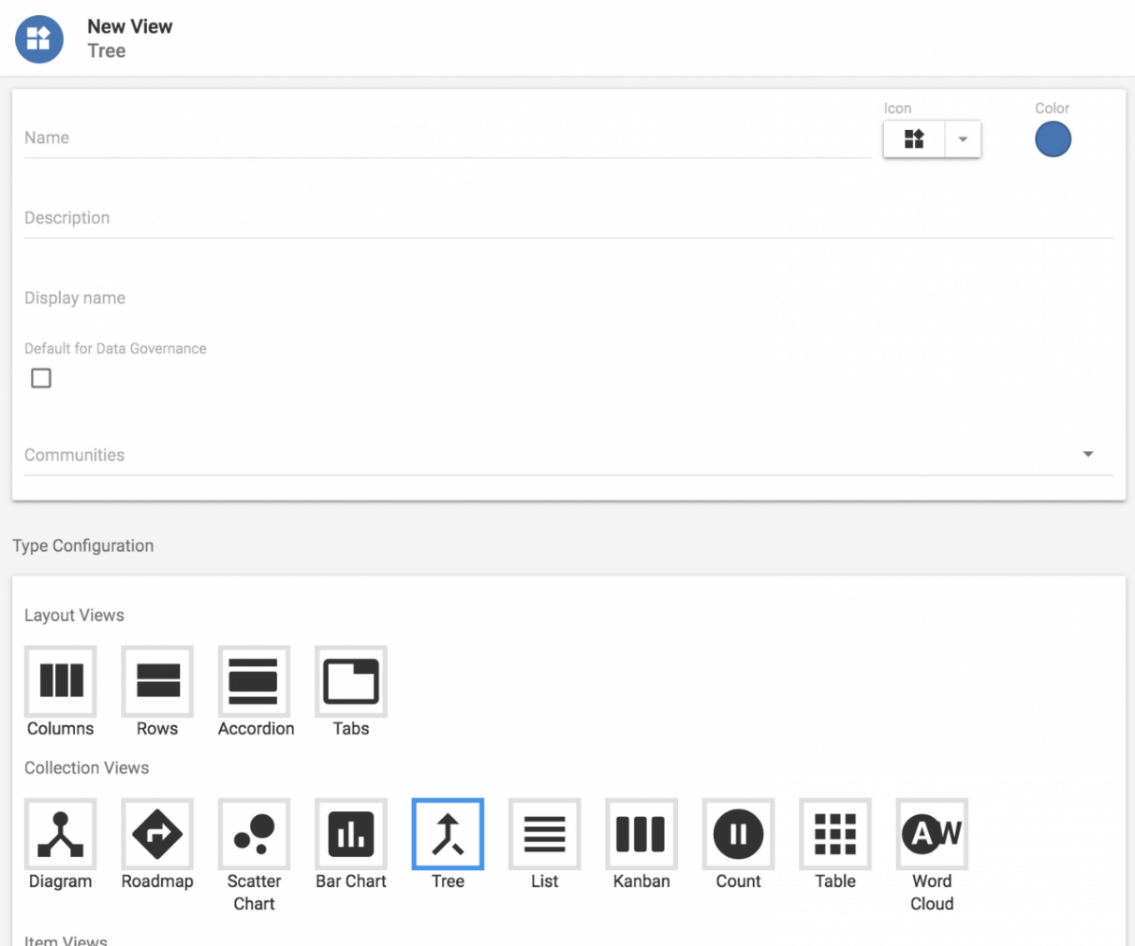
1. Select ‘Tree’ from Collection Views
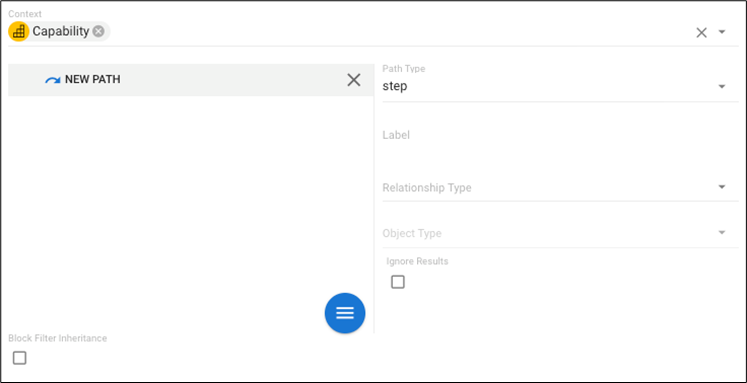
2. Tree Views can work with either Filters or Journeys. We recommend using Journeys to get the most out of this view type.
|
|
To create a Journey to define the structure of your tree please read the Journeys help file for guidance on how to create one |
3. Once you have defined your Journey, select your name attributes
4. Once you have finished configuring your Tree View click ‘Save’.
Table View
How Do I Create a Table View?
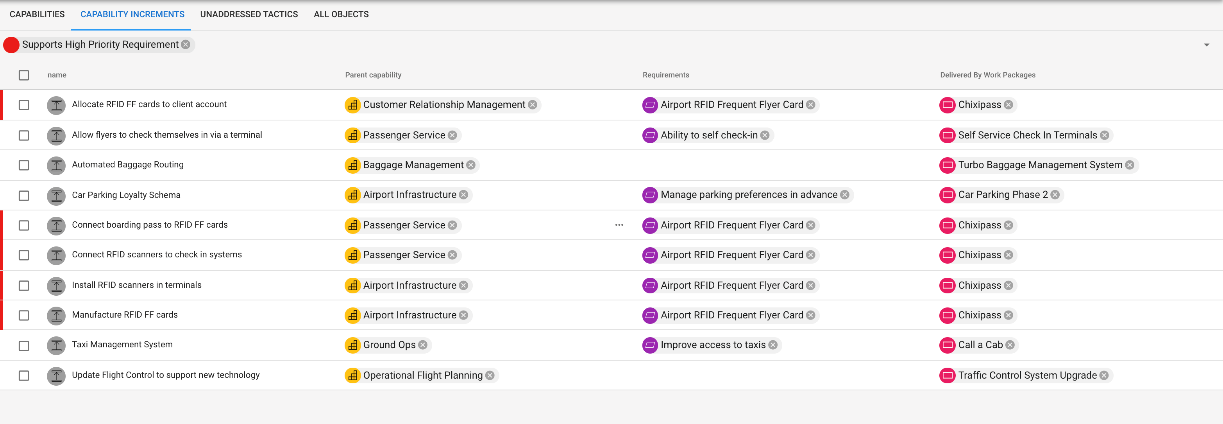
An example of a Table View displaying related objects.
An example of a Table View displaying various object attributes
|
|
Before starting you must read and follow the instructions in the New View help page. |
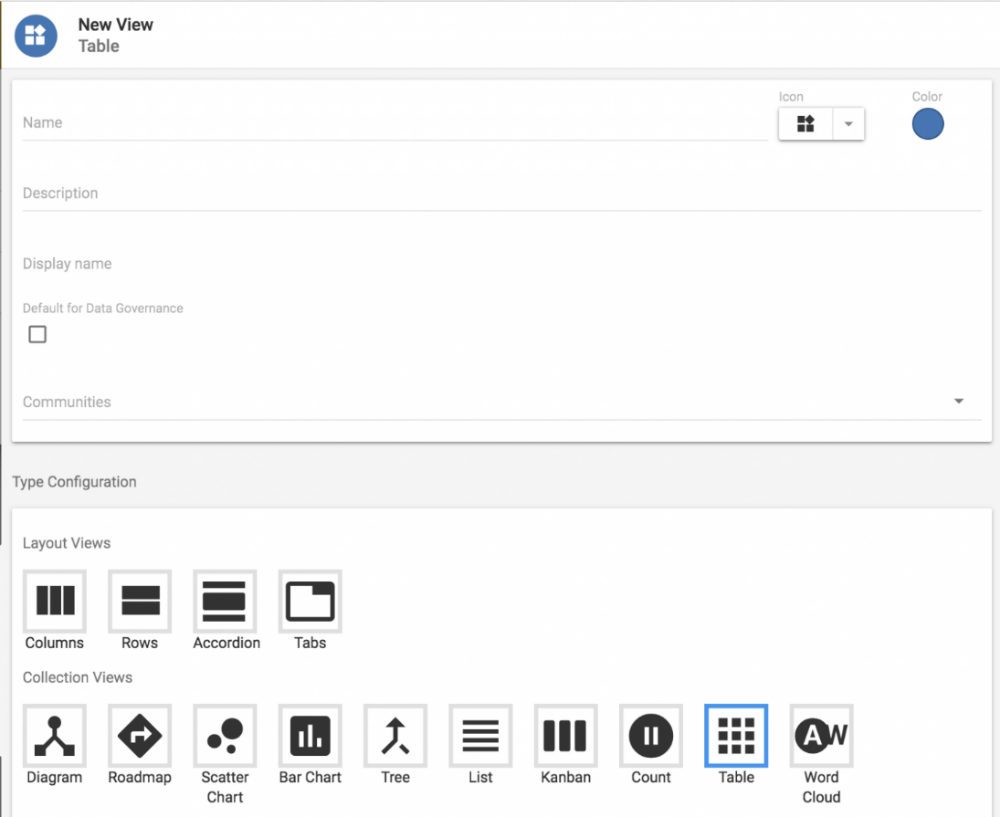
1. Select ‘Table’ from Collection Views.
2. Filters, Journeys & Queries can be used in Tables. Filters will return your Object in column A and your selected display attributes in the remaining columns. Journeys will display across the columns but with no additional properties & Queries can return a journey across the metamodel with properties of objects at each step.
For more on how to create a filter or a Journey please visit the Filters, Journeys or Queries
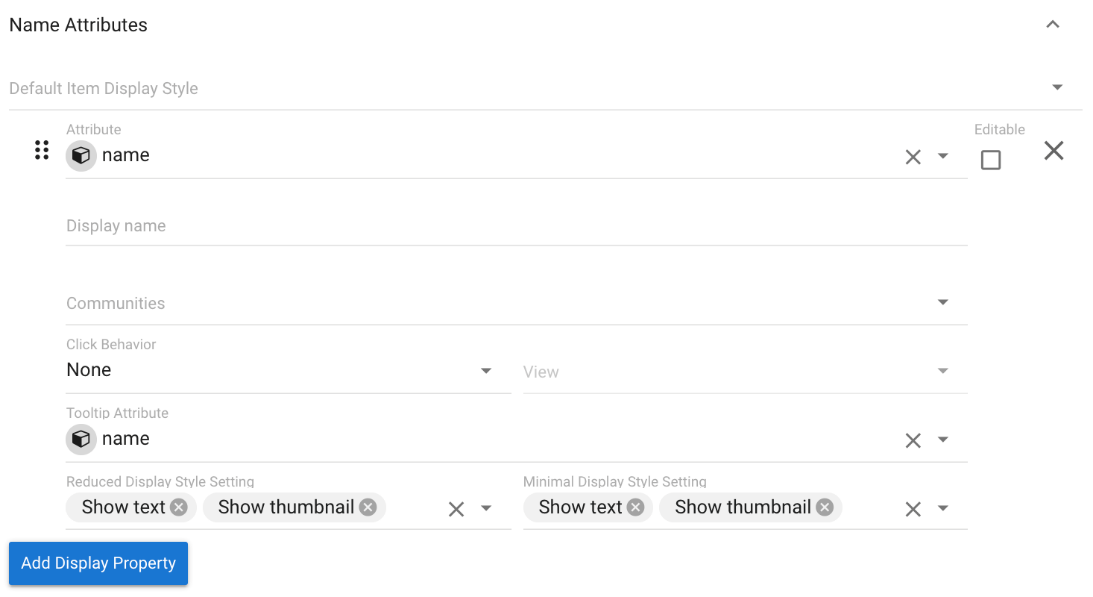
3. You will then need to select which Attributes are displayed in the columns of your Table
a. Generic Attributes are Attributes that are in all Object Types
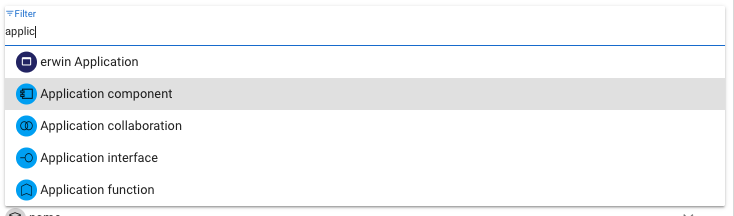
b. If you want to display Attributes that are only of the Object Type you’re creating your display view for. You can either select the Object Type manually or search for a specific term
c. This will bring a list of Object Type specific Attributes. Below the example is for Application Component
4. To allow users to change the Attribute there is a checkbox labeled ‘Editable’. Unselecting this box will lock the attribute
5. To restrict the Attribute to a Community, click the ‘Communities’ field. If you wish the Property to be viewed by all leave this field blank
6. You can now choose whether the Attribute has a Click Behaviour. There are 5 options:
i.Context:
ii.None: Nothing will happen when the Attribute is clicked
iii.Open In Panel: A side panel will pop out
i❖.Navigate To: Redirected to a new page displaying the set view
❖.Open In Dialogue: The set view pops up in a box in the centre of the screen
Open In Panel, Navigate To & Open In Dialogue require you to set a View to navigate to. Clicking in the ‘View’ field allows you to select a View by searching by name, select from a list or create a new view. The most common choice is ‘Default View For Type’
7. To add additional Attributes, click ‘Add Display Property’ and repeat from Step 4
8. Once you have finished configuring your Table View click ‘Save’
Scatter Chart
How Do I Create a Scatter Chart?
|
|
Before starting you must read and follow the instructions in the New View help page. |
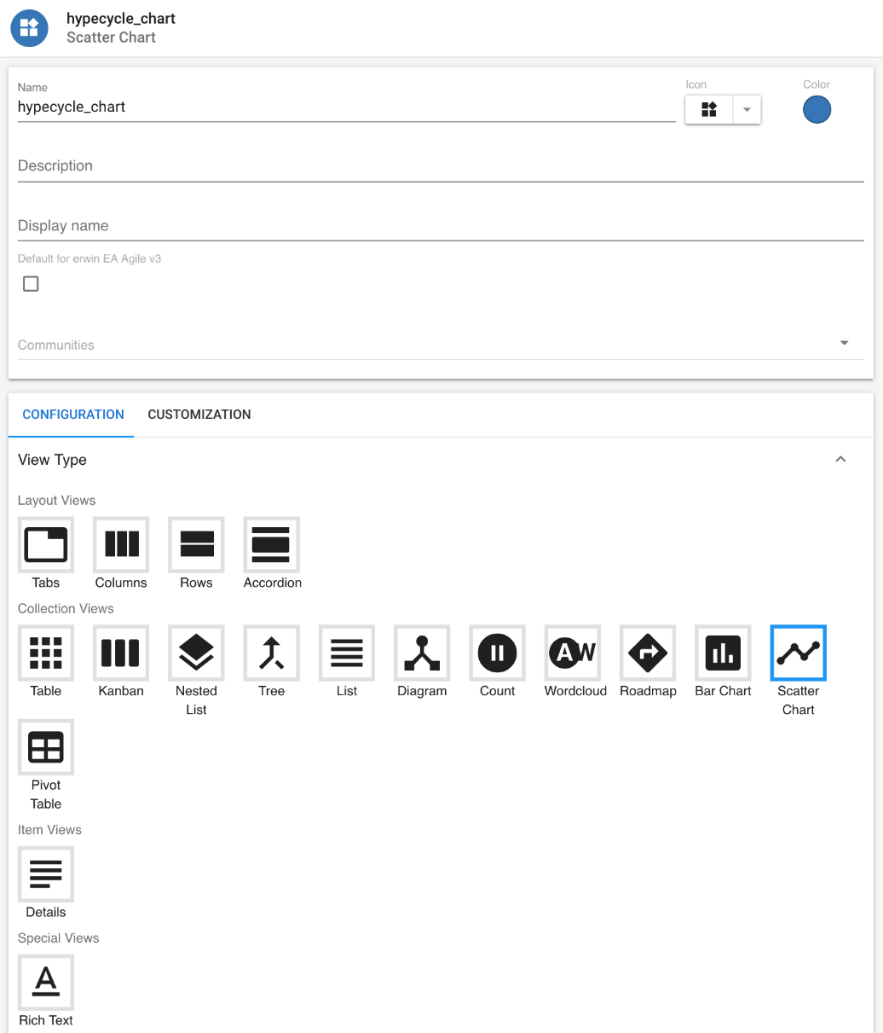
1. Select 'Scatter Chart' from Collection Views.
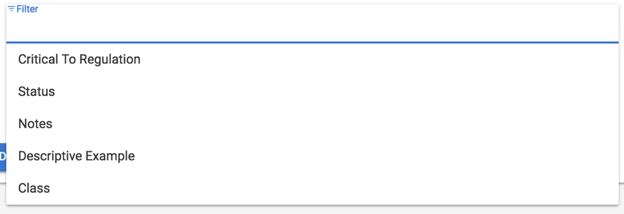
2. Add a Filter so your list only displays the instances you require. You can either select a filter or create a new one (For more on how to create a filter please visit the Filters help file)
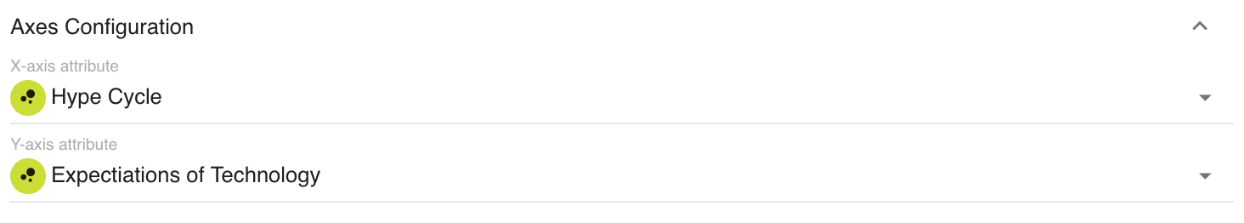
3. Select your X and Y Axis Attributes (These can only be an integer attribute type)
4. Click 'Save'.