Open the Run Reports viewer to view a list of all test result reports.
To open Run Reports
See Using Benchmark Factory Run Reports for more information.
From Run Reports, you can import or export run results.
To import or export testing results:
Navigate to the required folder to import or export the test results.
Benchmark Factory Run Reports provides a wide array of graphs, charts, and data that allow you to a analyze load testing scripts.
To open a test, double-click on the test name, or select the test name and click the Show Test Results icon in the upper right corner of the dialog.
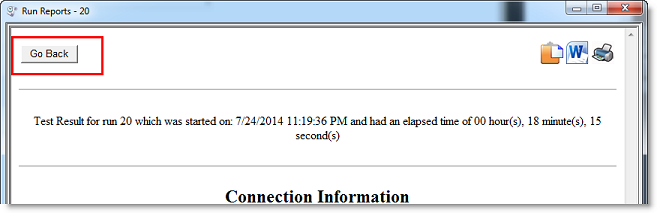
When Benchmark Factory Run Reports opens, the Results Summary displays. Click Go Back to return to the previous screen.
To navigate Benchmark Factory Run Results
Run Reports provides the following views:
The Results Summary provides graphs and user load statistics for the selected test. The following graphs and tables are provided:
Note: Not all tests provide the Results Summary graph.
This is a customizable graph that allows you to view selected data points.
To add or remove datapoints to the Results Summary graph
In the lower section of the graph, click Customize.
In the upper left corner, click Click here to Add Datapoints.
The Add Datapoints dialog displays.
Select the required datapoints.
Click Ok.
The selected datapoints display.
The Results Summary view allows you to view other graphs that provide test details.
To view other Results Summary Graphs
The following graphs display:
Understanding how user loads affect the performance of a database is essential to end user satisfaction. The Userload graph plots user load against:
Reviewing these datapoints allows you to fully understand how "real-world" userloads affect database performance.
The Realtime Statistic graph allow you to view what "actually" happened during a load test. You can plot userload against:
The Realtime Detail graph allows you to view what actually happened during the running of a load test. This allows you to view the actual timing events. From the Realtime Detail graph you can view:
This table is a snapshot of the workload test. You to quickly review a complete overview of database that includes, userload, transactions per second (TPS), average response time (sec).
From this table you can drill down to view userload stastics.
To drill down from the Userload Statistics table
The Userload Results view displays.
This displays detailed test results broken down by row name.
The Workload view provides testing details.
Clicking Details displays the transactions mix, timing, userload, and testing options used for the test.
The Testbed view shows data on agent configuration and processes during the running of a job.
Clicking Details displays a table with machine and operating system details.
This view displays connection and database information.
Click Details to display connection and database information details.
Benchmark Factory allows you to view and compare multiple results using Run Reports.
To view multiple Run Reports results
The results for that test display.
The following graphic shows Testbed drill down results.
The Results Summary graphs display.
Note: To change Run Reports graph views, refer to Changing Graph Views.
View other graphs as required.
You can export test results to Microsoft Excel from the Compare Results page and from the Run Reports component.
Note: Microsoft Excel must be installed to perform the following procedure.
To export load test results from Run Reports
In Run Reports, click the Excel icon .
To export test results to Excel from the Compare Results page