立即与支持人员聊天
与支持团队交流

Foglight Hybrid Cloud Manager 1.4 - User Guide (for AWS environments)

Monitoring Tab

When navigating to the Cloud Manager dashboard for the first time, the Monitoring tab appears. The Monitoring tab allows you to select a monitoring object or a group of objects, such as regions, accounts, EC2 instances, or EBS, and review the data associated with your selection.

3
On the navigation panel, under Homes, click Cloud Manager, and then click AWS.
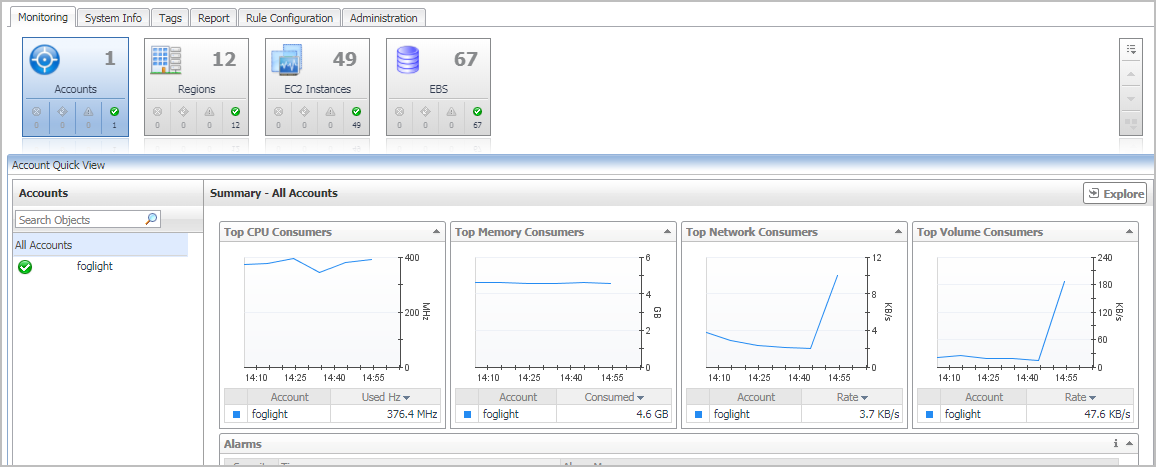
The Cloud Manager dashboard opens
5
Select the Regions, Accounts, EC2 Instances, or EBS tile from the top left.

For more information, see the following topics:

Regions monitoring

The Regions view shows the data collected about a specific region or all AWS regions. For more information, see the following topics:

Regions view

The Regions tree view lists the regions existing in your AWS environment and shows their state. This view appears on the left when you select the Regions tile in the Actions bar.

Figure 6. Regions view

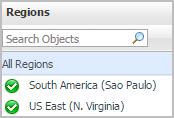
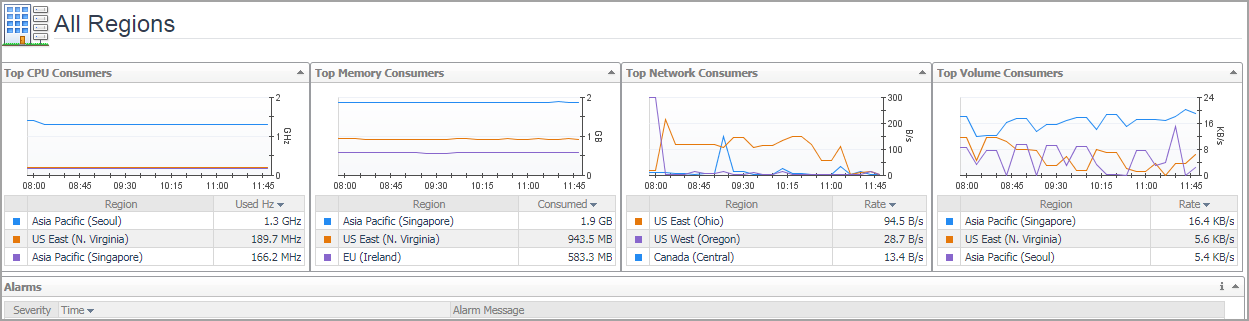
Selecting the All Regions node displays the Summary - All Regions view on the right. Similarly, selecting a region node shows region-specific metrics in the Region Summary view on the right.

Alarm severity. The state of the most recent alarm raised against the associated virtual machine.
All Regions. A parent node for the regions that appear in this view.
Region. The region name.

Drill down on:

All Regions. Shows the Summary - All Regions view on the right.
Region. Shows the Region Summary view on the right.

Explore - All Regions view

The Explore - All Regions view appears when you click Explore in the Summary - All Regions view.

This view consists of the following embedded views:

Table 2. Alarms

Lists the alarms generated against the selected virtual machine.

Alarm Message. An explanation about why the alarm occurred.
Severity. Indicates the alarm severity: Warning, Critical, or Fatal.
Time. Indicates when the alarm occurred.

Drill down on:

Alarm Message, Severity, or Time. Displays the Alarm Created dialog box, showing additional information about the alarm. For more information about alarms, see the Foglight User Help.

Shows the top three consumers in all regions.

CPU Consumers. Indicates top 3 CPU Utilization usage regions.
Memory Consumers. Indicates top 3 memory usage regions.
Network Consumers. Indicates top 3 network usage regions.
Volume Consumers. Indicates top 3 volume usage regions.

Drill down on:

相关文档

The document was helpful.

选择评级

I easily found the information I needed.

选择评级