Explore - Volume view
The Explore - Volume view appears when you click Explore in the EBS Summary view.
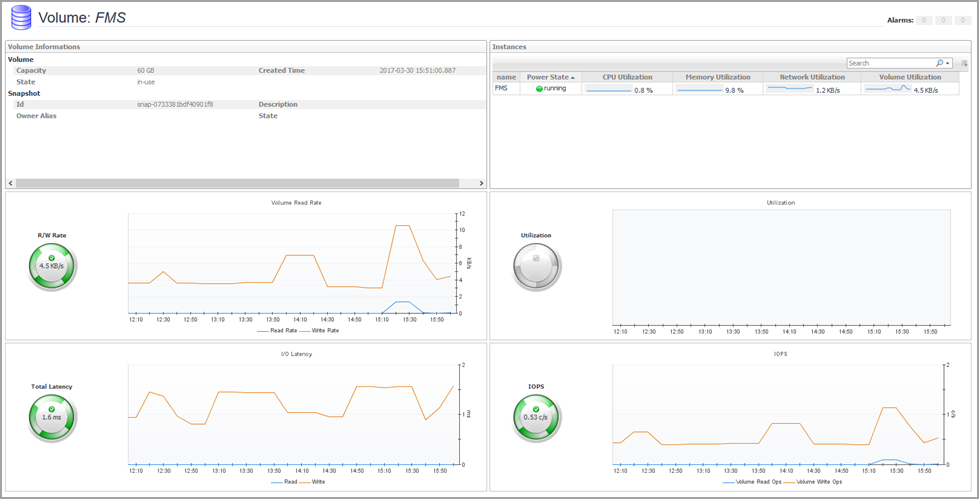
This view includes the following embedded views.
System Info Tab
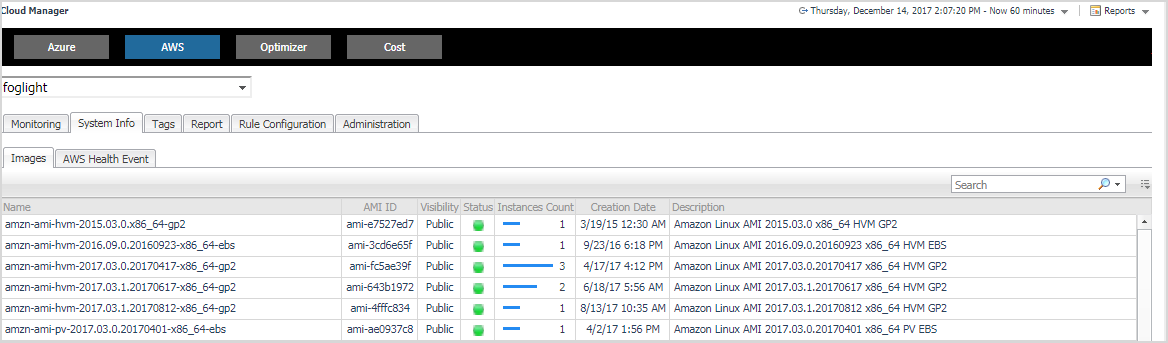
The System Info tab of the Cloud Manager dashboard contains the Images and AWS Health Event tables to help you understand the monitored AWS environment.
The Cloud Manager dashboard opens.
|
4 |
Click System Info in the actions bar. |
The System Info view opens on the bottom of
Cloud Manager dashboard.
For more information, see the following topics:
|
|
|
• |
Name. Shows the image name. | |
|
|
|
|
|
|
• |
Visibility. Indicates whether the image is public or private. | |
|
|
|
• |
Status. Indicates whether the image is available or pending. | |
|
|
|
• |
Instances Count. Shows the total number of EC2 instances that are created by this Amazon Machine Image (AMI). | |
|
|
|
|
|
|
|
|
|
• |
Name. Shows the event name. | |
|
|
|
• |
Region. Indicates the region in which the event occurred. | |
|
|
|
|
|
|
• |
Status. Indicates the event status. | |
|
|
|
• |
Last Update. Shows the date when the event was last updated. | |
|
|
|
Tags Tab
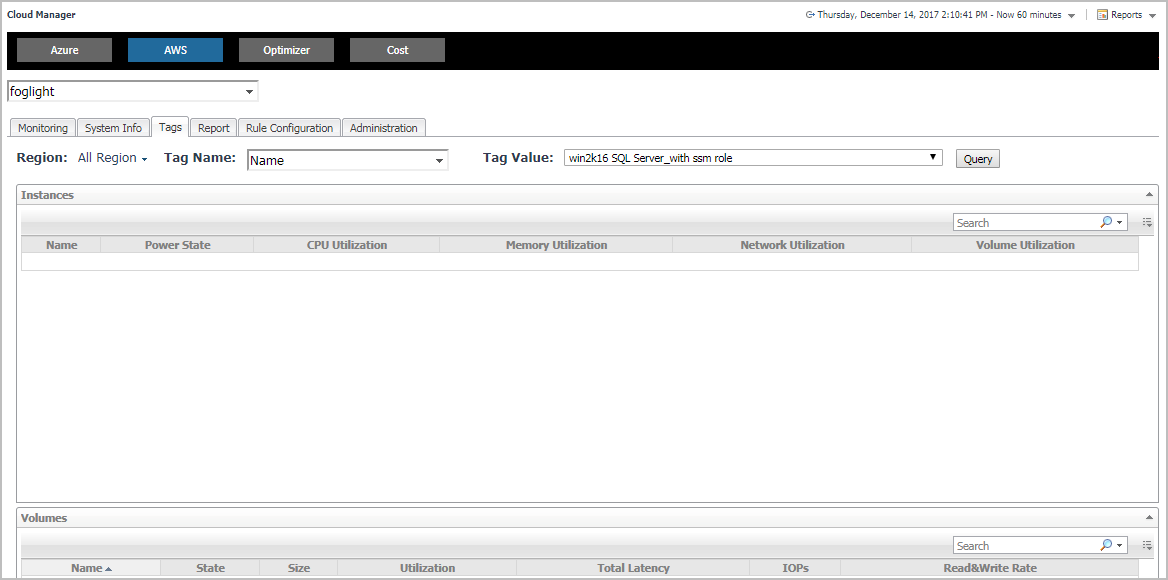
The Tags tab of the Cloud Manager dashboard helps you quickly search for instances or volumes using tag name and tag values.
The Cloud Manager dashboard opens.
|
4 |
Click Tags in the actions bar. |
The Tags view opens on the bottom of
Cloud Manager dashboard.
The Hybrid Cloud Manager for AWS provides the following query options:
|
• |
Region: Lists all regions or available regions, for example, Singapore. |
|
• |
Tag Name. Sort out all tags that belong to the selected Region. |
|
• |
Tag Value. Sort out all tags that belong to the selected Tag Name. |
The Instances table shows Name, Power State, CPU Utilization, Memory Utilization, Network Utilization, and Volume Utilization of the instances that include the specified tag name or value. The Volumes table shows Name, State, Size, Utilization, Total Latency, IOPS, and Read&Write Rate of the instances that include the specified tag name or value.
Report Tab
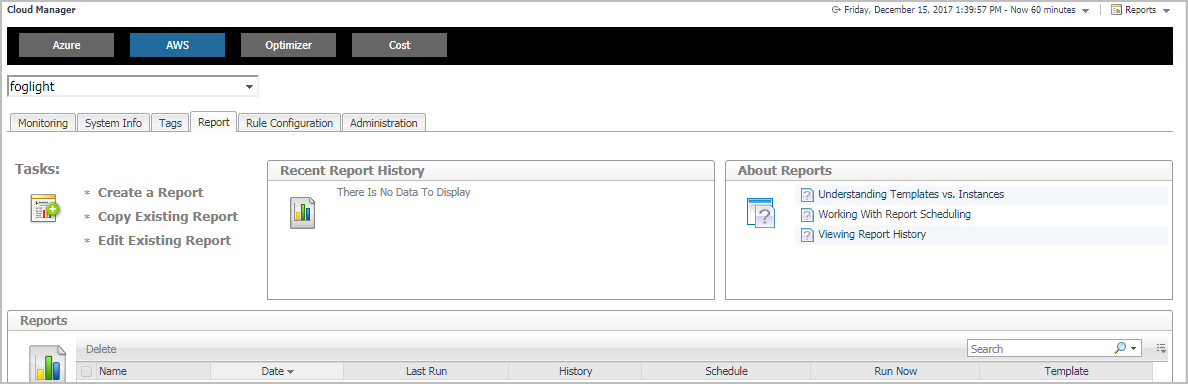
Foglight Hybrid Cloud Manager for AWS includes a report generation ability. This allows you to create reports using a set of predefined templates to report on the various aspects of your cloud environment. Foglight Hybrid Cloud Manager for AWS includes a collection of predefined report templates.
You can generate, copy, and edit reports using the Reports tab on the Report dashboard, or alternatively the Reports dashboard included with the Management Server.
The Cloud Manager dashboard opens.
|
4 |
Click Report in the actions bar. |
For complete information about this tab, see the Managing Capacity in Virtual Environments User Guide. For more information about the Reports dashboard, see the Foglight User Help.
