EBS monitoring
The EBS view shows the data collected about a specific EBS or all EBSs. For more information, see the following topics:
EBS view
The EBS view is a tree view. It lists the EBS instances existing in your environment, and shows their severity state.This view appears on the left when you select the EBS tile in the Actions bar.
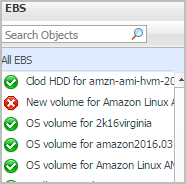
Selecting the All EBS node displays the overall resource utilization for all EBS instances in your integrated system and identifies the ones that consume the highest amount of system resources in the Summary - All EBS view on the right. Similarly, selecting a storage node shows storage-specific metrics in the EBS Summary view.
Summary - All EBS view
The Summary - All EBS view displays overall information for all EBS instances in the selected service and identifies the elements that consume the highest amount of resources. This view appears on the right when you select All EBS in the EBS view.
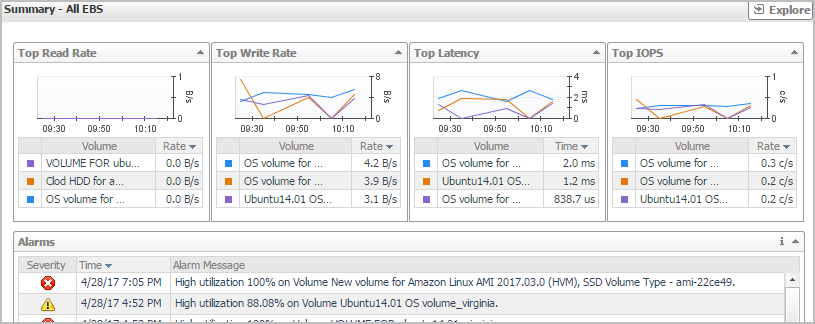
This view consists of the following embedded views:
EBS Summary view
The EBS Summary view displays complete details for an EBS instance. This view appears on the right when you select an EBS instance in the EBS view.
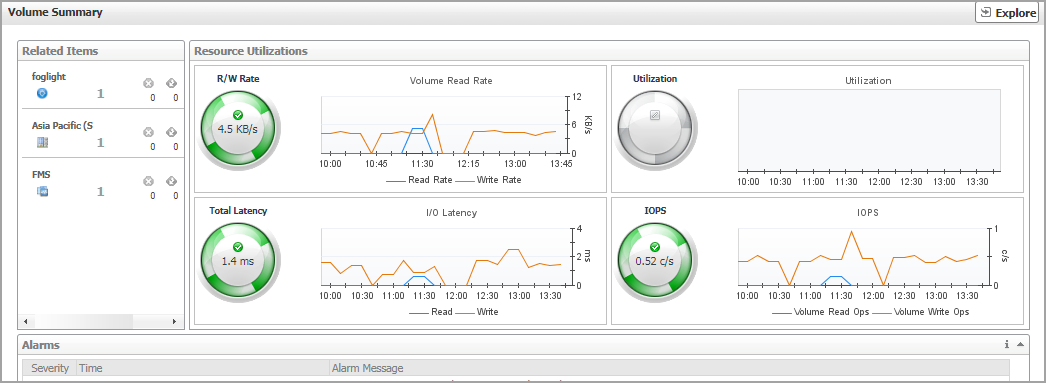
This view consists of the following embedded views:
|
|
Shows the numbers and states of the selected EBS instance running on the monitored AWS environment. |
|
|
|
• |
EC2 Instances. The number of the ECS2 instances that are associated with the selected account, followed by related alarm counts, broken down by the alarm state (Normal, Warning, Critical, Fatal). | |
|
|
|
• |
Regions. The number of the regions that are that are associated with the selected account, followed by related alarm counts, broken down by the alarm state (Normal, Warning, Critical, Fatal). | |
|
|
|
• |
Accounts. The number of the accounts that are that are associated with the selected region, followed by related alarm counts, broken down by the alarm state (Normal, Warning, Critical, Fatal). | |
|
|
Drill down on: |
|
|
|
• |
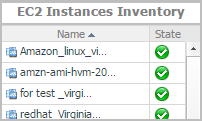
EC2 Instances. Displays the EC2 Instances Inventory dwell, showing the name and state of the associated Resource Groups. |
|
|
|
|
• |
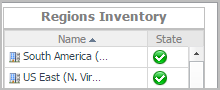
Regions. Displays the Regions Inventory dwell, showing the name and state of the associated accounts. |
|
|
|
|
• |
Accounts. Displays the Other Items Inventory dwell, showing the name and state of the associated accounts. |
|