Job Monitor
The Job Monitor displays the list of all scripts stored in the Space Manager repository for a database. Use the Job Monitor to view script status and monitor script execution.
You can use the Job Monitor to perform the following tasks:
- View a list of scripts currently in the Repository
- View the status of each script
- Monitor execution of a script or script group
- Monitor a live reorganization
- View error codes
- Review execution logs
- Open a script in the SQL Editor
Most scripts remain listed in the Job Monitor throughout their history: before, during, and after execution. Scripts are cleared from the monitor when they are deleted from the repository.
To open the Job Monitor
- In the Explorer, select a database for which you want to view scripts.
- Select Manage | Script/Job Monitor. The Job Monitor opens displaying the scripts for the selected database.
To refresh, filter, and modify the display
To monitor script execution in the Job Monitor
- Select a script or script group from the list in the Job Monitor. To filter the list, use the Group by field or click the filter icon
 in a column header.
- To see the list of scripts in a script group, right-click the script group and select Show Detail.
- Script status for each individual script displays in the Status Message column in the Detail pane. If a script fails, the error code is displayed.
- To view details about an individual script, right-click a script in the Detail pane and select Show LiveReorg Detail. You can use the LiveReorg Detail pane to monitor the progress of a live reorganization from the Job Monitor window. See Monitor Live Reorganizations for more information.
- To view script logs, right-click a script in the Detail pane and select Retrieve Script Logs. To view the latest logs for a script group, right-click the group name in the main list and select Retrieve Script Group Logs.
- To change the switch approval method for online scripts, right-click the script group in the upper pane and select Properties. See Change Approval Method for Online Scripts for more information.
- To learn more about tasks for managing scripts, see Manage Scheduled Scripts.
Toolbar Functions
Use the following toolbar functions to view, monitor, and manage scripts from the Job Monitor window.
 |
Execute the selected script. |
 |
Stop the selected script. |
 |
Restart the selected script. |
 |
Open the selected script in the SQL Editor. |
 |
Open Properties for the selected script or script group. |
 |
Delete the selected script. |
 |
Schedule the selected script. |
 |
Unschedule the selected script. |
 |
Approve the switch. |
 |
Change approval type. |
 |
Refresh the Job Monitor window. |
 |
Retrieve script logs for the selected script. Double-click a log in the list to view it in the SQL Editor in read-only mode. Enabled only for scripts in the Detail pane. |
 |
Show/Hide Detail pane. |
 |
Show/Hide LiveReorg Detail pane. Enabled only for Live Reorg scripts in the Detail pane. |
Note: To learn about managing DML Profile scripts, see Smart Start for DML Profiler.
Related Topics
Status Codes for Script Execution
Job Monitor Display Options
The Job Monitor provides several options that allow you to customize the display of scripts, including:
- Group scripts by status or type
- Filter the list of scripts
- Save multiple custom layouts (displays)
- Specify refresh rates for the Job Monitor window and the QSA status display.
Tip: Use grouping and filtering together to further narrow the list of scripts.
To group scripts
- In the Job Monitor toolbar, select a category in the Group by list.
-
Select one of the following options:
- Script Type
- Script Status
- To quickly find active scripts, group by Script Status.
To filter scripts
-
You can filter scripts by column values. Click in the column header and select a value.
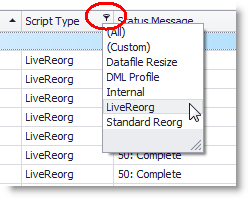
- To filter using two or more values or to create an advanced filter, click and select Custom.
- When the filter is applied, the filter description displays in a box in the footer of the upper pane. To remove the filter, click the close button in the filter box.
- To modify the current filter, click Edit Filter in the filter box.
To save a custom layout (display)
- Use grouping, filtering, and sorting to create a custom display in the Job Manager window.
- When finished, click Layout | Save.
- Give your custom layout a name and click OK.
- To apply the layout, click Layout | Load and select the custom layout. When applied, the name of the custom layout displays in the status bar at the bottom of the window. If the saved layout includes a filter, it is displayed in the footer of the upper pane.
Refresh Rates
For executing scripts, refreshing the monitor updates it with the statements currently being processed. Refreshing the QSA status panel updates it with information on whether QSA is running, not running, or not installed.
To refresh Job Monitor immediately
- Click in the Job Monitor toolbar.
To set refresh rate for Job Monitor
- Click the Auto-Refresh button in the Job Monitor toolbar.
- Select the Automatically refresh scripts list every n seconds option. Then specify a refresh rate. The minimum refresh rate is an interval of five seconds.
To set refresh rate for QSA Server Agent status
- Select Tools | Options | QSA Server Agent.
- Specify a refresh rate. The minimum refresh rate is an interval of one minute.
Use Script Properties to Monitor Execution
You can use the Properties dialog for scripts and script groups to perform the following tasks:
- View or modify the execution schedule
- Change the approval method for the switch
- Monitor execution progress
- Monitor a live reorganization
To open the Group Properties dialog
- In the Job Monitor, right-click a script or script group and select Properties. This dialog provides high-level information for a script or script group.
To change or view schedule information (using Group Properties)
- Open the Group Properties dialog for a script or script group. Select the Group Attributes tab.
- In the Scheduling Info section, modify the schedule as necessary. See Schedule Scripts from Script Properties for more information.
To change approval method (using Group Properties)
- Open the Group Properties dialog for a script or script group. Select the Group Attributes tab.
- In the Approval Info section, change the approval method as necessary. See Change Approval Method for Online Scripts for more information.
To open the Script Properties dialog
- In the Job Monitor, double-click a script or script group to open the Detail pane.
- In the Detail pane, right-click a script and select Properties. This dialog provides detailed information for the selected individual script.
To monitor execution progress (using Script Properties)
- Open Script Properties for an individual script.
- In the Job Monitor, double-click a script or script group to open the Detail pane.
- In the Detail pane, right-click a script and select Properties.
-
Select the Execution Information tab.
- To monitor execution progress, check statement and count fields in the Execution Info tab.
-
To see how much of a script has been executed, compare the number of statements processed so far (in the Success Count field) to the total number of statements in a script (in the # of statements field).
Note: The Script Properties dialog (opened from the Detail pane) displays information only about the selected individual script.
Related Topics
Schedule Scripts from Script Properties
Monitor Live Reorganizations
- Select a group name and click in the Job Monitor toolbar.
- Right-click a group name and select Show Detail.
To open the Live Reorg Detail pane
|
| » |
Use one of the following methods to open the Live Reorg Detail pane in the Job Monitor: |
- Select a table script and click
 in the Job Monitor toolbar.
- Right-click a table script and select Show LiveReorg Detail.
