Chat now with support
Chat with Support

Foglight for vCloud Director 5.7.4.1 - User and Reference Guide

Getting Started Setting Up Monitoring Agents Investigating Resource Consumption Levels Investigating Object Dependencies Reference

Managing Alarms

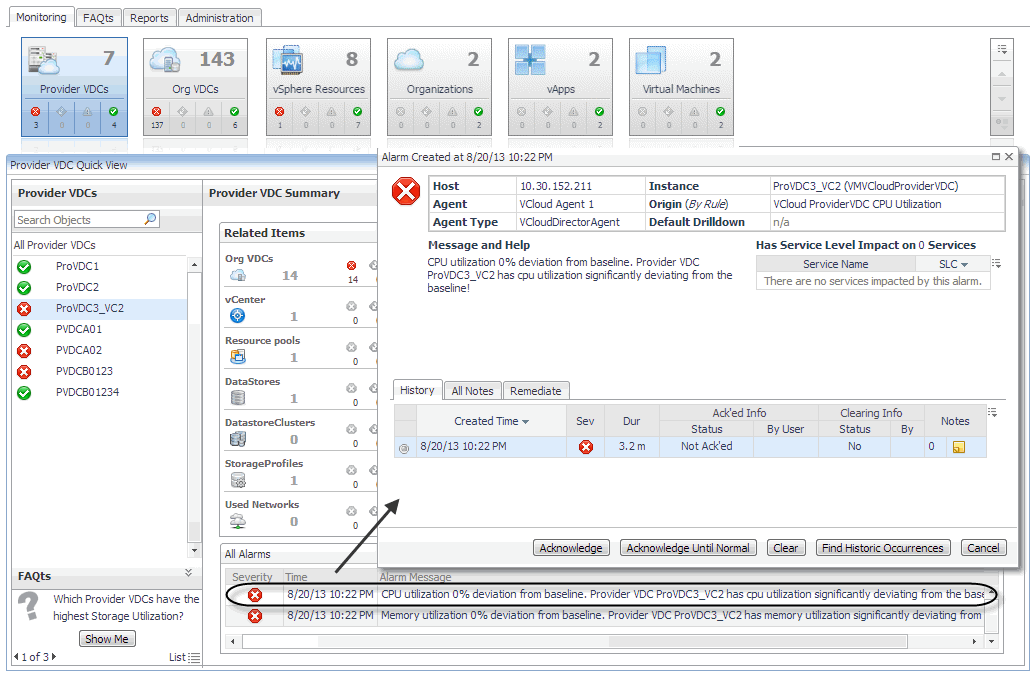
If any alarms are generated against the selected object, they appear along the bottom of the summary view. Drill down on an alarm to find out what triggered it, and to take steps to investigate further.

For complete information about alarms in Foglight for vCloud Director, see the Foglight for vCloud Director User Guide.

Reviewing FAQts on the Monitoring Tab

In the bottom-left corner of the Quick View you can navigate through the questions associated to the selected components type, and to review the answers.

You can review these questions in more detail using the FAQts tab. For more information, see Reviewing Frequently Asked Questions.

Reviewing Related Items

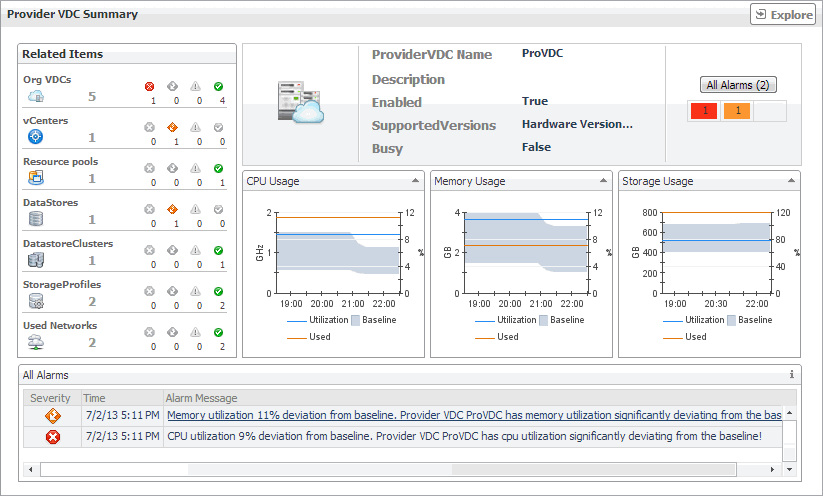
When you select an object in the left pane of the Quick View, you can quickly find out which objects are associated with the selected object, and to find out their alarm state. The combination of items in this view depends on the type of object selected. For example, if you select an organization object, this view identifies the related organization vDCs, vApps, running virtual machines, groups, and users. Selecting a provider vDC displays the associated organization vDCs, vCenter, resource pools, datastores, datastore clusters, storage profiles, and used networks.

o

The type of the related item. For example, organization vDCs, vCenter, resource pools, datastores, datastore clusters, storage profiles, or used networks.

The number of items in this category.

The number of items in each severity state.

Monitoring Organizations, Organization vDCs, and Provider vDCs

An organization in vCloud Director® terms is a collection of users, groups, and resources that are available to users. Encapsulated CPU, memory, and storage resources, that are available to an organization comprise an organization vDC (virtual datacenter). A provider vDC combines the CPU, memory, and storage resources of the associated resource pools and datastores.

You can monitor the collective resource usage, allocation, and overhead of these monitored objects when you select them on the Monitoring tab. The information appearing in this view can help you discover potential resource-level issues such as spikes in CPU, memory and disk usage, and to reallocate resources where they are most needed.

1
On the navigation panel, under Dashboards, click vCloud Director > vCloud Environment.
2
On the vCloud Environment dashboard, on the Monitoring tab, click one of the following tiles: Provider vDCs, Organization vDCs, or Organization.
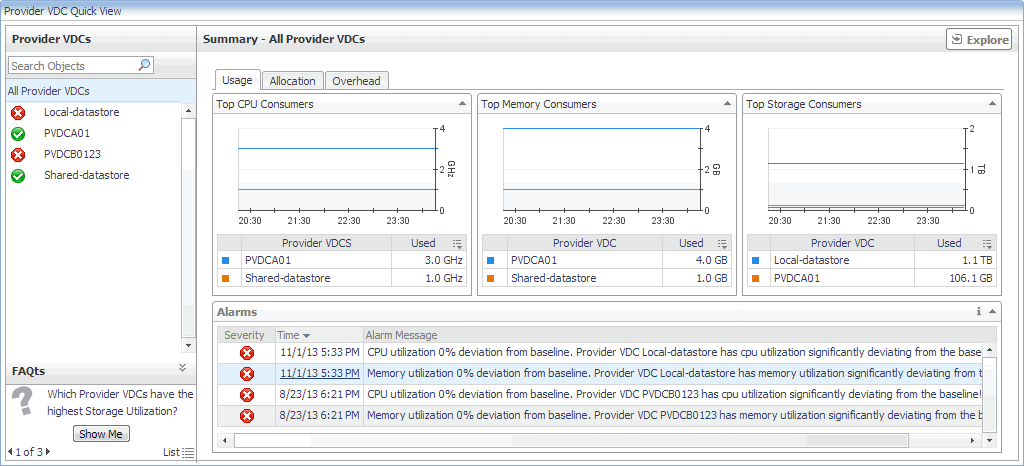
The Quick View refreshes, showing the performance summary of all selected components in the right pane. For example, if you select the Provider vDC tile in this step, the Provider vDC Quick View displays the Summary - All Provider vDCs view on the right.
Figure 14. Provider vDC Summary view
Related Documents

The document was helpful.

Select Rating

I easily found the information I needed.

Select Rating