
Categories
This view lists the categories for which questions can be answered by Foglight for Infrastructure.
Click a category in the list to select it.
Questions
This view lists the questions, for the category selected in the Categories, that can be answered by Foglight for Infrastructure. A set of default questions are included with Foglight for Infrastructure.
Click a question in the list to select it.
|
• |
|
1 |
|
• |
Answers
This view provides an answer to the question selected in the Questions view. The answer appears on the right side of the dashboard, and it corresponds to the time interval specified in the Time Range (top right corner of the dashboard).
To view detailed information about one of the monitored hosts, click the hosts’s name in the table. This allows you to drill down to the Infrastructure Environment > Host_Name dashboard.
Exploring the Administration tab

The table includes the following columns:
The Administration tab’s toolbar includes the following buttons:
|
• |
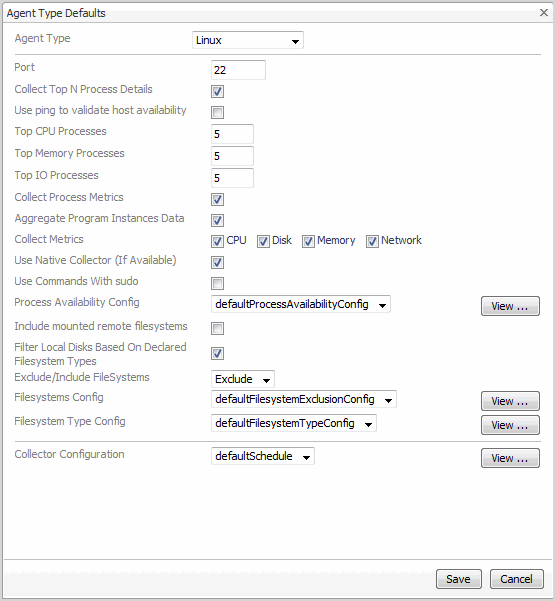
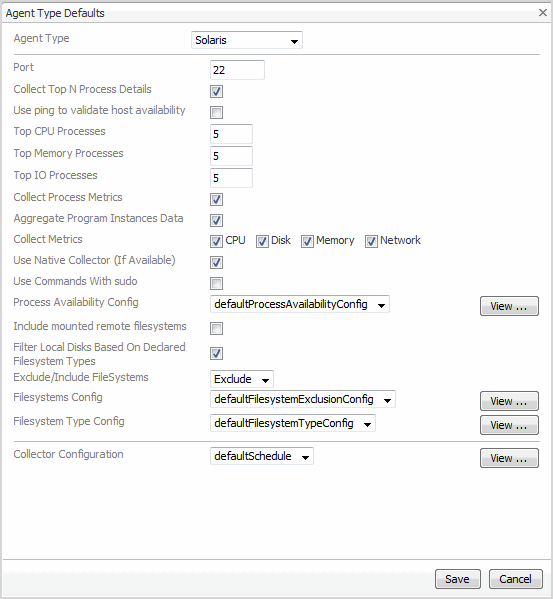
Type Defaults: allows you to edit the default agent type properties. |
|
• |
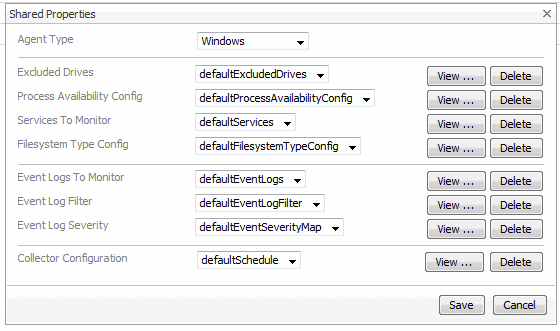
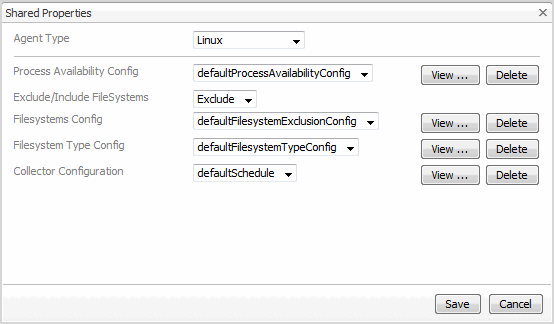
Shared Properties: allows you to edit the shared agent type properties. |
|
• |
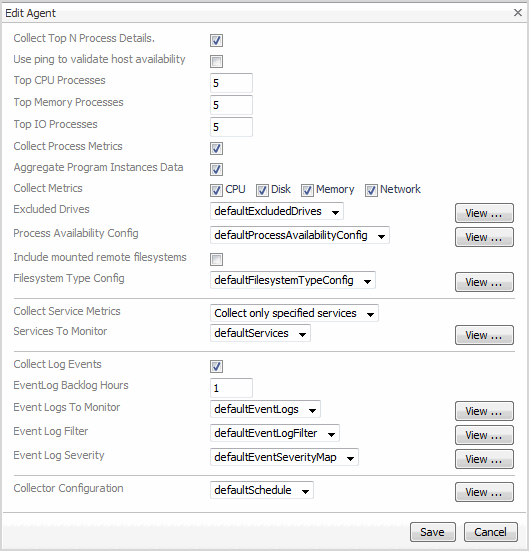
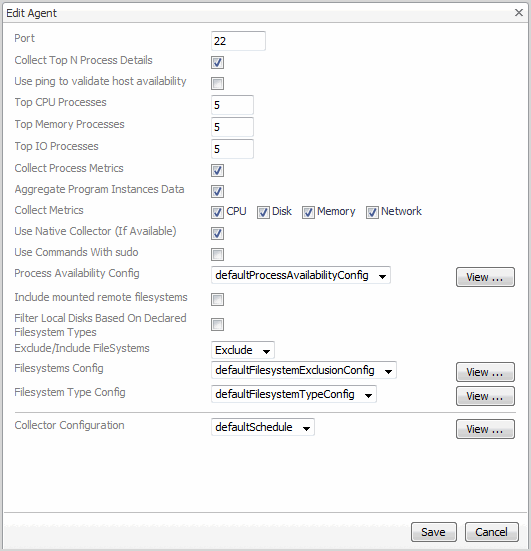
Edit Agent: allows you to edit the agent properties for the selected host or hosts. |
|
1 |
Click Type Defaults. |


|
• |
Edit: allows you to edit the currently selected property list, by adding and removing rows. |
|
• |
Copy: allows you to edit the displayed properties and save the copy as a new shared property list. When saved, the copy becomes the selected item in the drop-down list. |
|
4 |
Click Save to save the changes made to the default properties. |
|
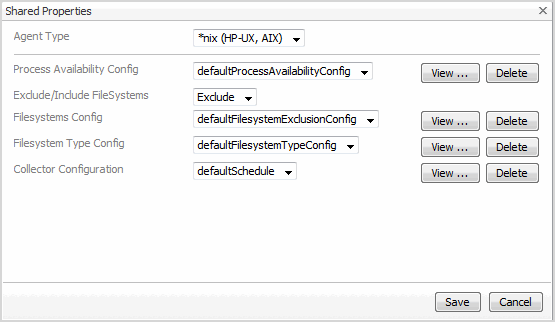
1 |
Click Shared Properties. |

|
• |
Edit: allows you to edit the currently selected property list, by adding and removing rows. |
|
• |
Copy: allows you to edit the displayed properties and save the copy as a new property list. When saved, the copy becomes the selected item in the drop-down list. |
|
4 |
Click Save to save the changes made to the shared properties. |
|
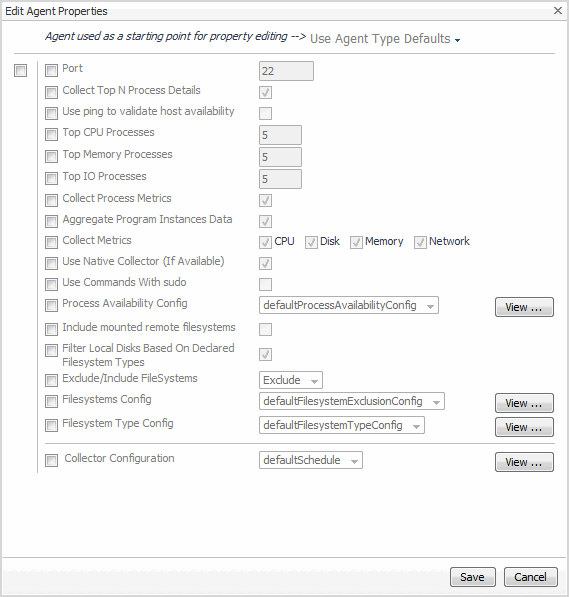
2 |
Click Edit Agent. |

|
2 |
Click Edit Agent. |
|
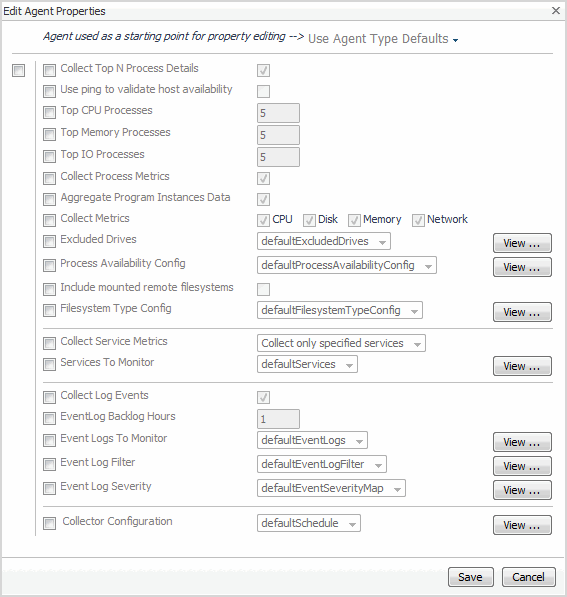
3 |
Select the monitoring agent that should be used as a starting point for editing the properties for this agent type. From the drop-down list, select Use Agent Type Defaults or one of the available host names. |
|
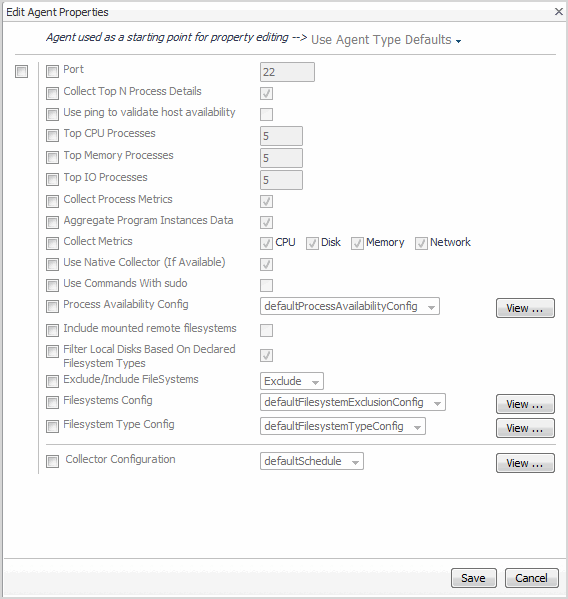
5 |
Click Save to save the changes made to the agent properties. |