Monitoring the performance of your XenDesktop environment
When you deploy Foglight™ for Citrix XenDesktop and XenApp and set up the monitoring agents for data collection, the XenDesktop Environment dashboard enables you to review the performance of your environment at a glance. use this dashboard to ensure consistent application performance, by drilling down for details about individual components, to look for the indicators of performance degradation, such as high CPU load or network utilization.
A typical XenDesktop® environment contains a set of servers, delivery groups, desktops, and applications. You can view the overall state of these components on the XenDesktop Environment dashboard. To access this dashboard, under Dashboards, click XenDesktop.
|
• |
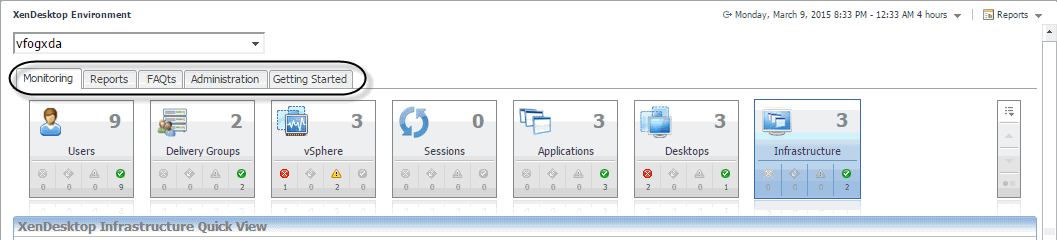
Monitoring: Use this tab to review data specific to the main components of your monitored environment such as servers, delivery groups, desktops, applications, sessions, or vSphere resources. When you navigate to the XenDesktop Environment dashboard for the first time, the Monitoring tab appears open. This tab provides an overall summary of your monitored environment. It is described in this section. |
|
• |
Reports: Use this tab to run and schedule Foglight for Citrix XenDesktop and XenApp reports. For more information, see Generating reports. |
|
• |
FAQts: Use this tab to review the answers to common questions about your monitored systems. For more information, see Reviewing Frequently Asked Questions. |
|
• |
Administration: Use this tab to discover XenDesktop® hosts, and to manage XenDesktop Agent instances. For more information, see Setting up data collection agents . |
|
• |
Getting Started: Use this tab to activate, purchase, or renew your Foglight license. For more information, see Activating Foglight for Citrix XenDesktop and XenApp licenses. |
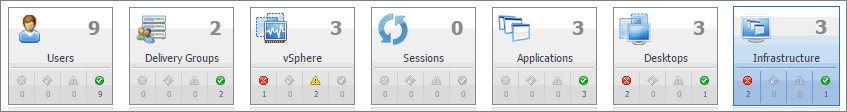
A set of tiles along the top of the Monitoring tab gives you a quick overview of the monitored objects: servers, delivery groups, desktops, applications, sessions, and vSphere® resources. Each tile represents a collection of a specific object type, shows the object count, and the count of objects in each alarm state (Normal, Warning, Critical, and Fatal).

For complete information about alarms in Foglight™ for Citrix XenDesktop and XenApp, see the Foglight for Citrix XenDesktop and XenApp User Guide.
Activating Foglight for Citrix XenDesktop and XenApp licenses
Foglight for Citrix XenDesktop and XenApp is license-protected. When you install it for the first time, it comes with a 40-day trial license. You can activate it using the Getting Started tab. You can also use this tab to purchase or renew your Foglight for Citrix XenDesktop and XenApp license when your existing trial or commercial license expires. For more information, see the Foglight for Citrix XenDesktop and XenApp Release Notes.

Investigating the performance of XenDesktop infrastructure components
A typical XenDesktop® infrastructure consists the following high-level components:
|
• |
XenDesktop Site represents your monitored XenDesktop environment, consisting of Delivery Controllers, virtual desktops that they distribute to end-users, and other associated components. |
|
• |
Delivery Controllers distribute virtual desktops to end-users, manage user access, and optimize connections. |
|
• |
License servers allow Citrix® licenses to be shared among application components. |
|
• |
StoreFronts represent services that provide users with access to applications and desktops. |
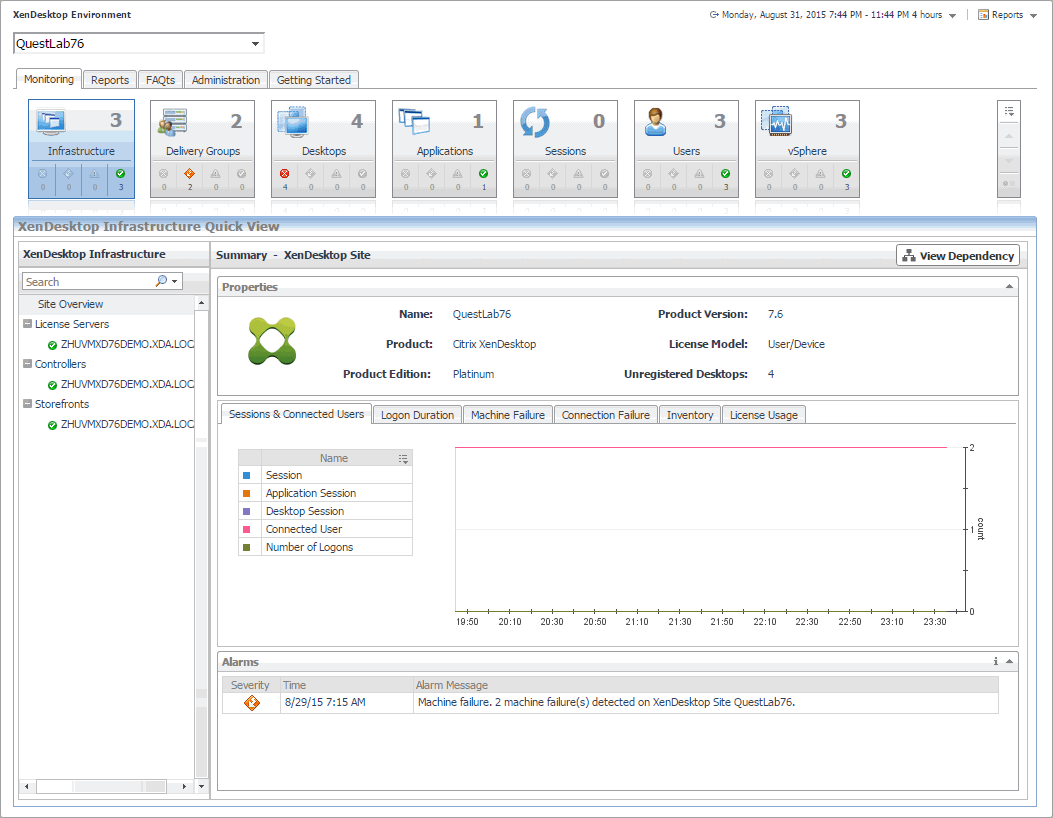
You can monitor the performance of these components when you select the XenDesktop Infrastructure tile on the XenDesktop Environment dashboard.
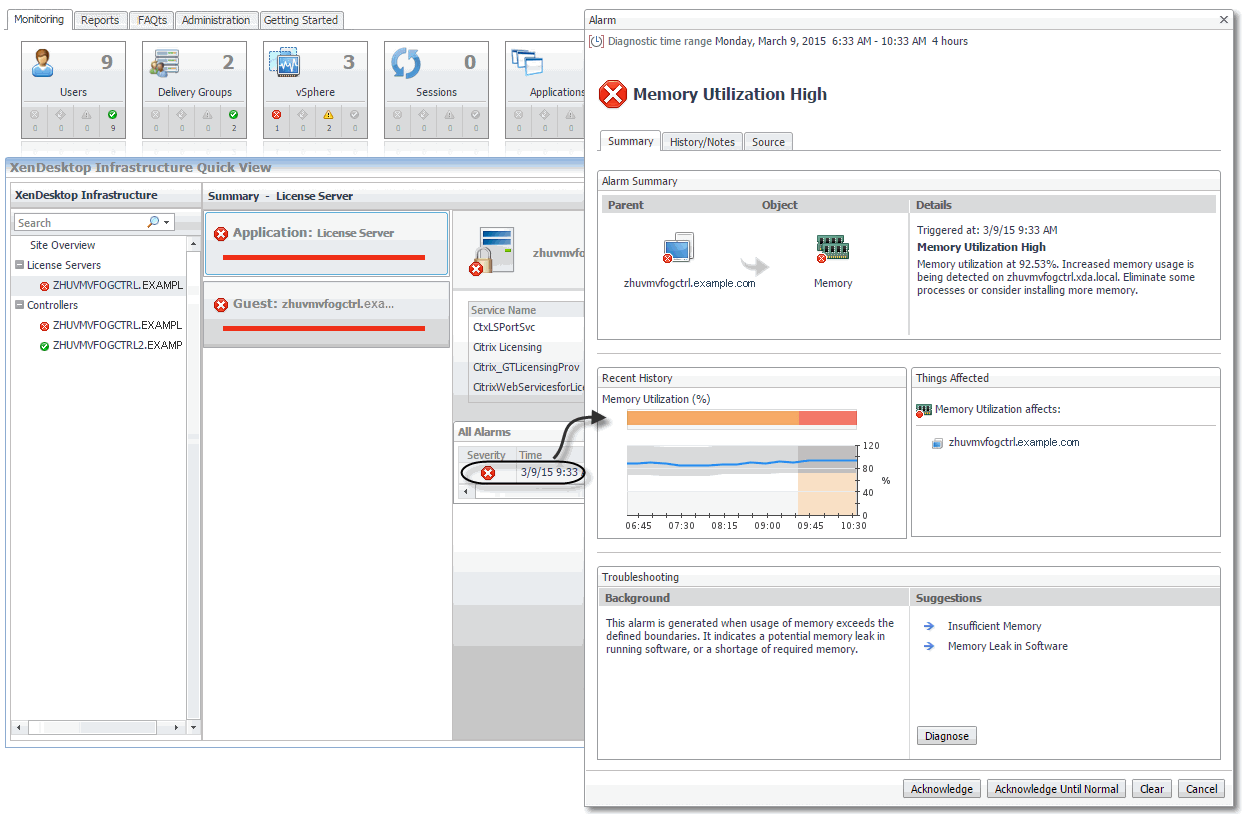
The information appearing in the XenDesktop Infrastructure Quick View can help you discover potential resource-level issues such as spikes in session trends, and to reallocate resources where they are most needed.
|
1 |
|
2 |
On the XenDesktop Environment dashboard, on the Monitoring tab, click the XenDesktop Infrastructure tile. |
|
3 |
In the XenDesktop Infrastructure Quick View, in the XenDesktop Infrastructure view on the left, click Site Overview. |
|
• |
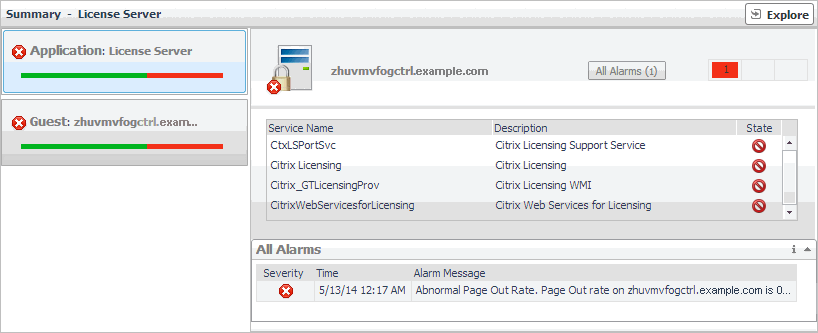
When the Application tile on left is selected this view shows the list of services running on the selected License Server or Delivery Controller, and displays any alarms associated with it. |

|
• |
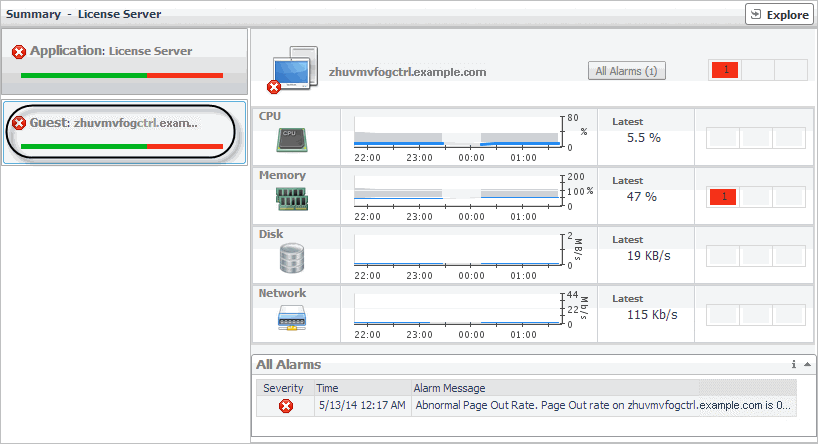
When you select Guest, the view shows the usage of system resources on the machine on which the selected License Server or Delivery Controller is running. |
|
6 |
|
• |
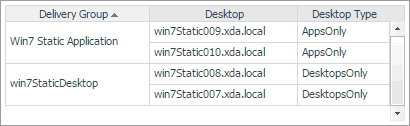
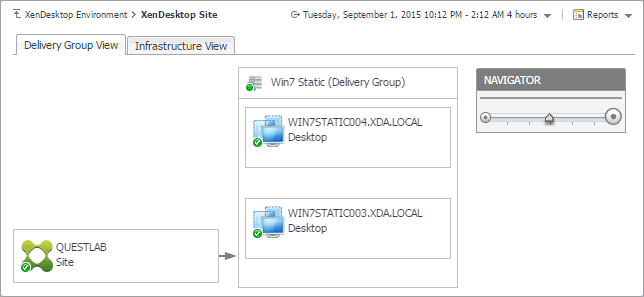
Delivery Group View: A Delivery Group specifies which users can access Desktops or Applications based on their user type. This tab illustrates the relationships between main components associated with the Delivery Groups that belong to the selected XenDesktop site, including any Delivery Groups, Desktops, and Applications provided by the Delivery Groups. |
|
• |
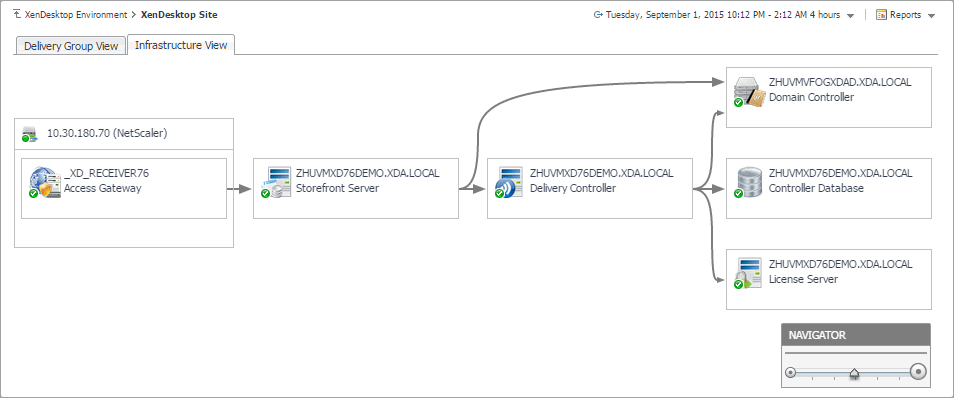
Infrastructure View: This tab illustrates the relationships between main infrastructure elements components associated with the Delivery Groups that belong to the selected XenDesktop site, such as the NetScaler Gateway, StoreFront Server, Delivery Controller, Domain Controller Database, and the License Server. |
Exploring XenDesktop sites
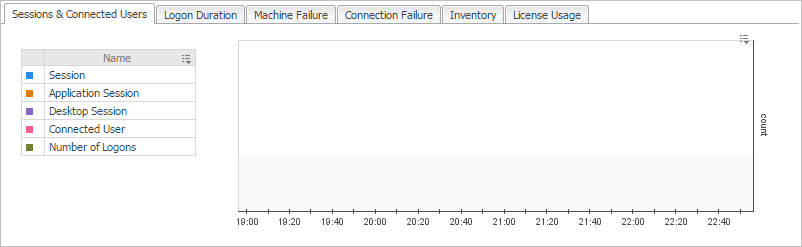
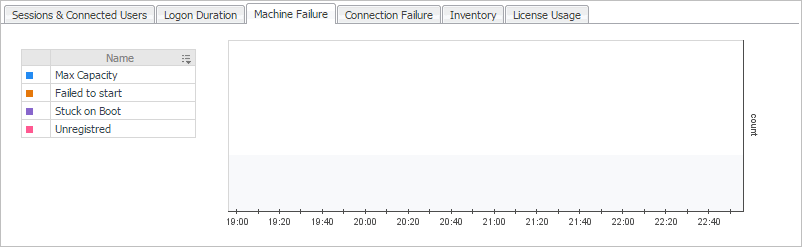
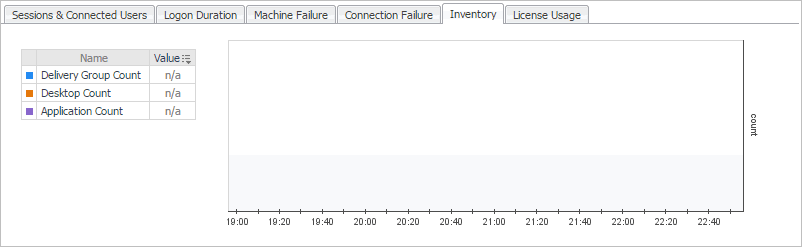
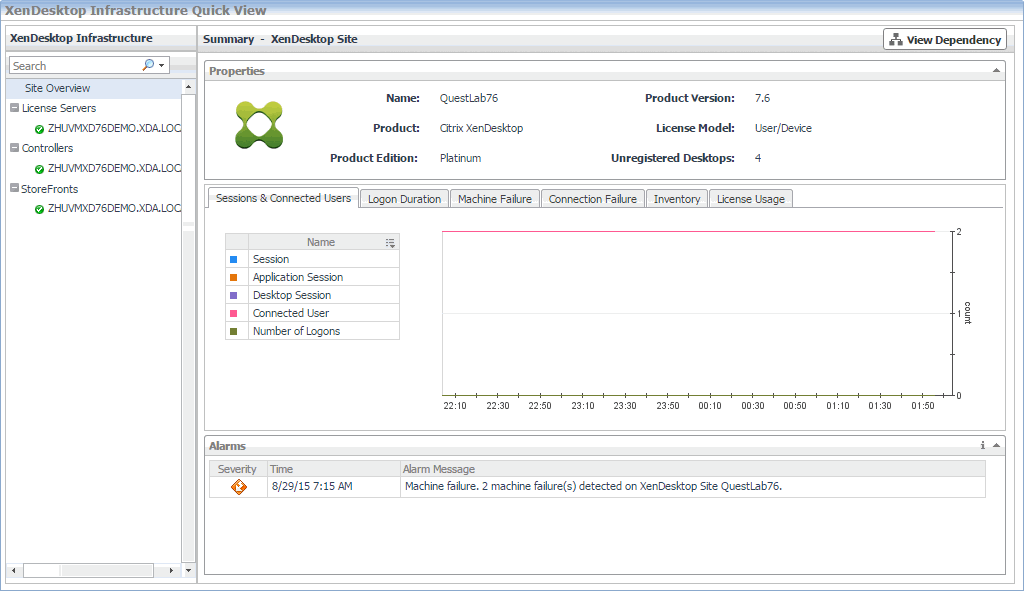
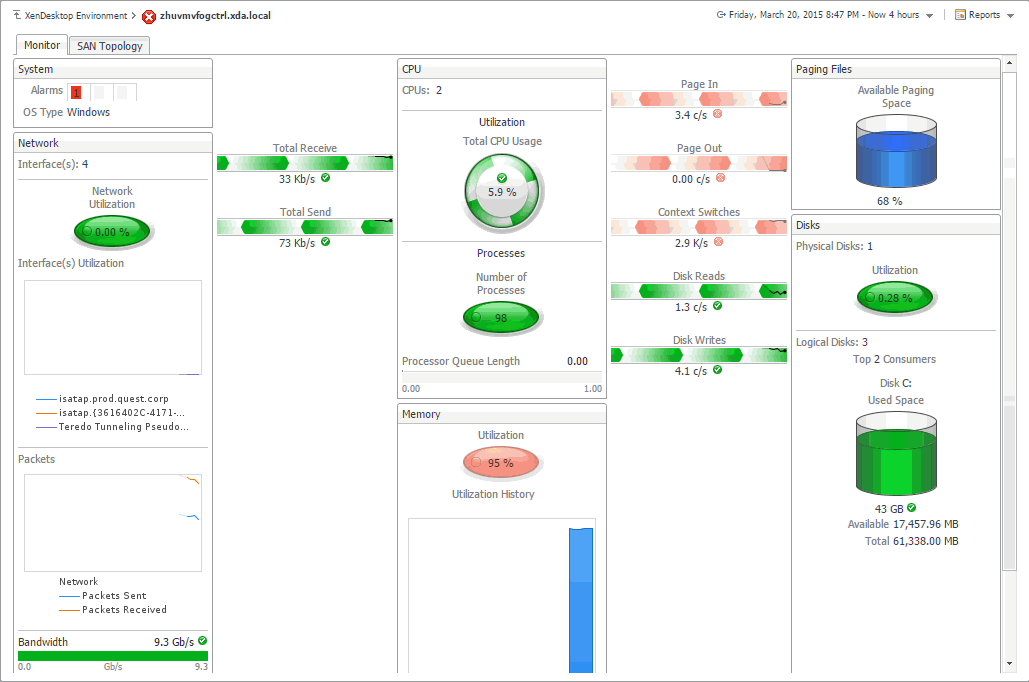
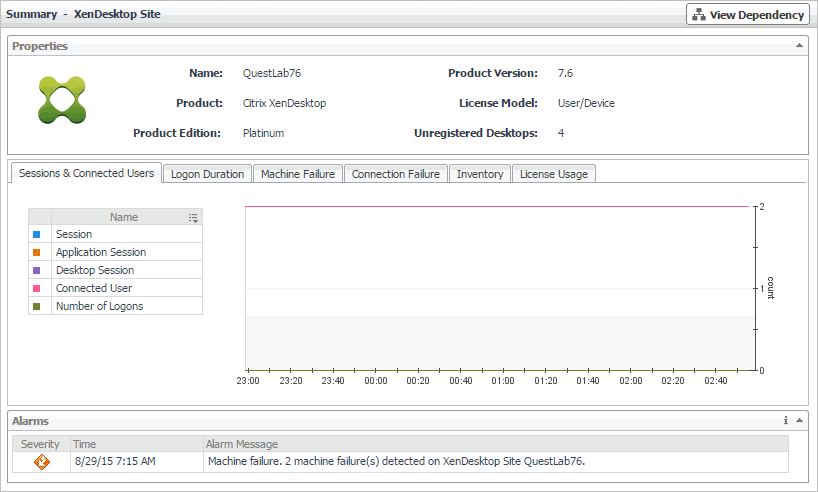
A XenDesktop Site represents your monitored XenDesktop® environment, consisting of Delivery Controllers, virtual desktops, and other associated components. The Summary - XenDesktop Site view allows you to review general information about the monitored XenDesktop site along with performance trends in session counts, logon duration, machine and connection failures. Use this view to review the general trends in the overall performance of your monitored XenDesktop site and to look for any indicators that suggest potential bottlenecks. For example, an unusually high number of connection errors can affect the end-user experience and should be investigated.
|
Click Unregistered Desktops to find out the names and types (desktop, application, or desktop and application) of the unregistered desktops, and the delivery groups they belong to. | |
|
The session and user counts over the selected time period. | |
|
The logon duration times over the selected time period. | |
|
The counts of system-related failure types over the selected time period. | |
|
The counts of connection-related failure types over the selected time period. | |
|
The counts of delivery groups, desktops, and applications over the selected time period. | |
|
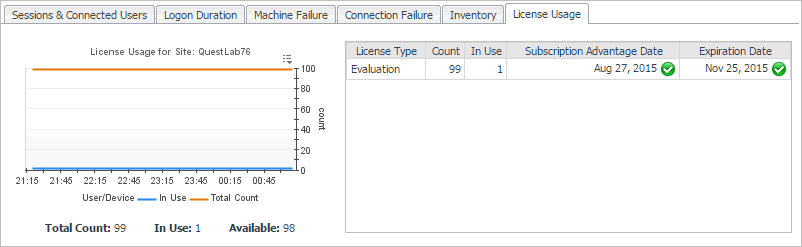
The counts of currently used licenses and available licenses over the selected time period. For each license type (for example, Evaluation), this view displays the total number of licenses, the number of used licenses, the dates when the licenses are first used, and their expiration date. Alarms are generated when the number of used licenses exceeds predefined thresholds. | |
|
|