

|
2 |
Click the Reponse Time Breakdown tab. |

|
• |
Click Explore Breakdowns to open the Response Time Breakdown Explorer dashboard. For more information, see Examining Response Times. |

|
TIP: If you click a datasource component icon, the chart also includes a Map to Application Component button. For more information, see Mapping datasources. |
|
• |
On the Transaction tab of the SOC, click Display Options. |

|
2 |

|
3 |

|
5 |
Select the Share this dashboard and allow it to be included in other custom dashboards check box. |
|
6 |
Click Next. |
|
7 |
On the Select Dashboard Layout page, select Fixed Size. |
|
8 |
Click Finish. |
|
1 |
On the action panel, click the Data tab. |
|
2 |
In the Data list, expand Services > All Services. |

|
4 |
Expand Real User Results and select the application component (for example, MD Admin). |


|
6 |
Click Select a view. The Create View wizard opens. |
|
7 |
On the Select a Template page, expand Application Performance Monitoring, and click Application Component Thumbnail. |

|
8 |
Click Finish. |
|
10 |
From the menu that opens, click Use previous selection. |


|
1 |
From the Data list in the action panel, drag and drop Synthetic User Results onto the dashboard display area. |
|
2 |
From the menu that opens, select Create a table. The Create View wizard opens. |
|
3 |
On the Select Properties page, select the Show All check box. |

|
5 |
Click Next. |
|
6 |
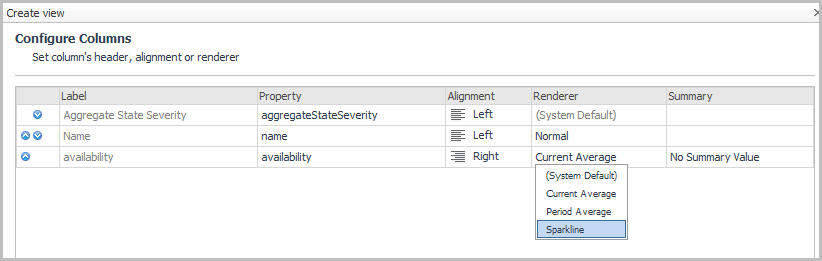
On the Configure Columns page, click in the Renderer box for the availability property and select Sparkline from the list. |
|
7 |
|
8 |
|
9 |
Click Next. |

|
11 |
On the action panel, click the General tab. |
|
12 |
Click Edit page layout. |
|
15 |
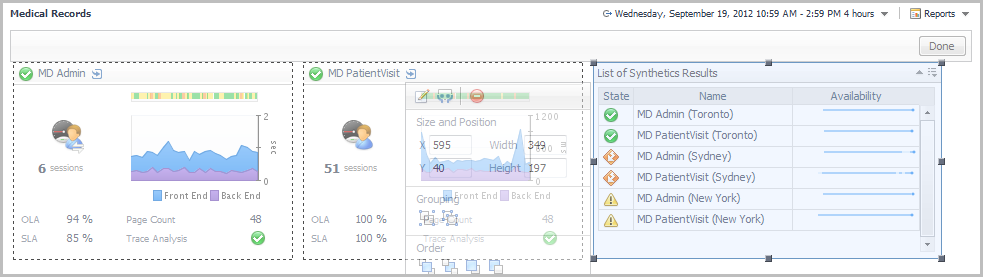
Click Done to lock the views in place and continue adding views. |
|
1 |
On the action panel, click the Data tab. |
|
3 |
From the menu that opens, click Select a view. |
|
4 |
Expand End User > Geographical Perspective > Measurements. |
|
5 |
Select Map of Users. |

|
6 |
Click Finish. |
|
8 |
From the menu that opens, click Use previous selection. |
|
9 |
On the action panel, click the General tab. |
|
10 |
Click Edit page layout. |

|
2 |
Drag and drop an application server from the JavaEE Application Servers list (for example, MedRec1Server1). |
|
3 |
On the menu that opens, click Select a view. |
|
4 |

|
5 |
Click Finish. |
|
7 |
On the menu that opens, click Use previous selection. |
|
9 |
Expand Oracle Instances and drag and drop a database server instance onto the dashboard (for example, MEDRECDB-MEDREC1). |
|
10 |
On the menu that opens, click Select a view. |
|
11 |
Expand Application Performance Monitoring and click Application Component Thumbnail. |
|
12 |
Click Finish. |
|
13 |
On the action panel, click the General tab. |
|
14 |
On the dashboard, click Done. |
