
|
• |
Click Find Related Hits to open the Search Hits page. For information about searching hits, see the Foglight APM User Guide. |
|
• |
Click Advanced Find to open a list from which you can select a specific type of search. Choose from hits with: back end violations, end to end violations, or errors. The Hit Search runs with your selected criteria. Any results are returned on the Search Hits page. For information about searching hits, see the Foglight APM User Guide. |
|
• |
|
• |

|
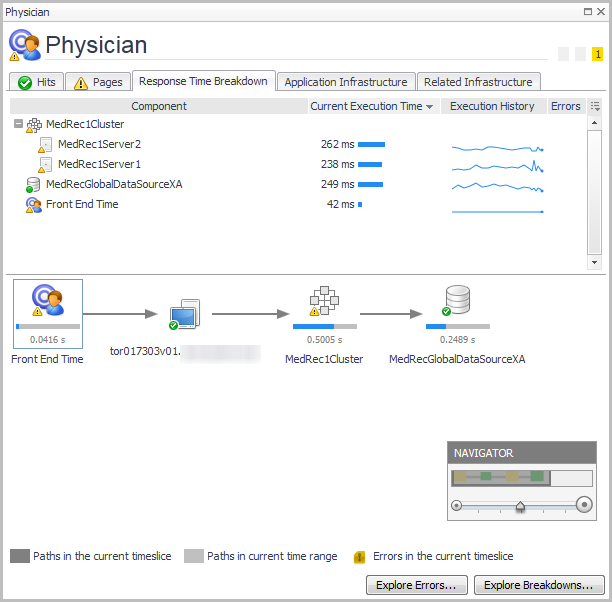
TIP: If you click a datasource component icon, the details view also includes a Map to Application Component button. For more information, see Mapping datasources. |

|
• |
|
• |
|
|
||
|
|
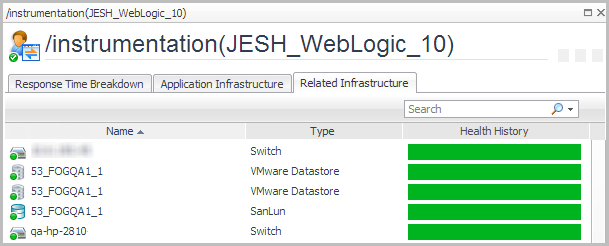
VMware® Datastore |
|
|
|
