Creating a CSV with Mappings
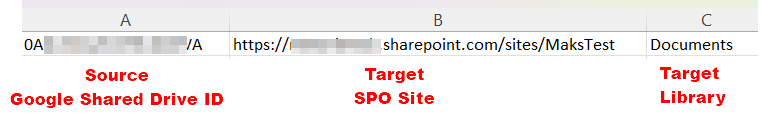
Before a Google Shared Drive to SharePoint Online Post Migration Compare report can be run, a CSV file must be created that maps each source Shared Drive and target site you want to compare. You can run a mapping report and modify it to contain only the source Google Shared Drive ID, target SPO site, and target library, as shown in the example below.
|
|
NOTE: If the mappings are incorrect or in the wrong format for the report, when you load the CSV file the message Mapping is incorrect will display in the UI. |
To perform a Google Drive to SharePoint Online Post Migration Compare:
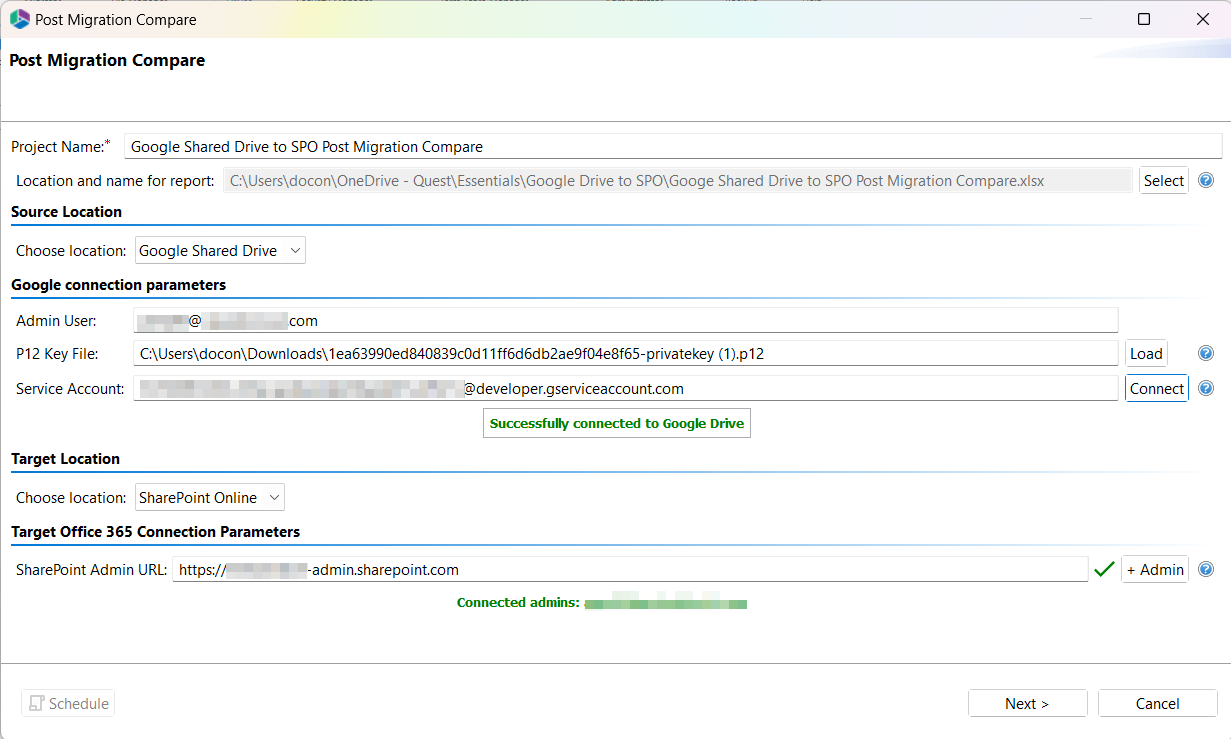
1.Once you have initiated a Post Migration Compare, enter a Project Name.
2.For Location and name for report, click the Select button, then select the name and location for the Excel output. (Essentials automatically adds the xlsx extension).
3.For Source Location, select Google Shared Drive and connect to Google Drive.
4.For Target Location, select SharePoint Online and connect to the Office 365 tenant.
5.Click Next to display the Check for availability of sites dialog.
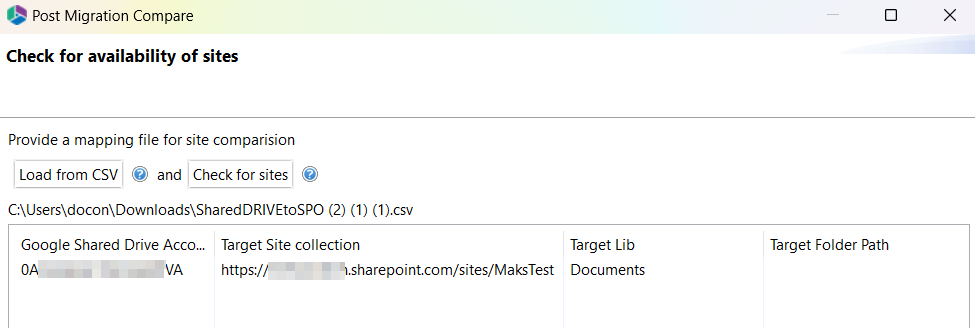
6.Click the Load from CSV button.
Essentials loads the mappings from the CSV file.
7.Click the Check for sites button.
Essentials retrieves the content for the mapped source and target site.
8.Click Next to display the Configuration of live compare dialog.
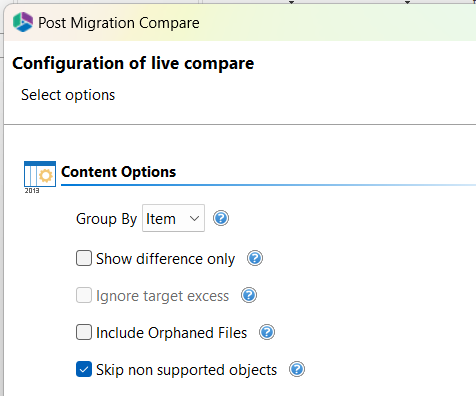
9.Select the Content Options for the report:
§Group By either List or Item.
§Show differences only:When this box is checked, the report will only show objects for which the count is different between the source and target. If you leave this box unchecked, the report will include all objects, regardless of whether the count is different. Count differences will be highlighted in red.
§Include Orphaned Files -When this box is checked, the report will include files that were created in a folder that was shared with a user and after the file was created, but their permission to the shared folder was removed. Including orphaned files will increase the time it takes for the report to run.
§Skip Non-Owned Files - When this box is checked, the report will exclude any content that exists in the user's Google Drive "My Drive" area that is not owned by the user.
§Skip non supported objects - When this box is checked, any files that are not supported in Office 365 will be skipped.
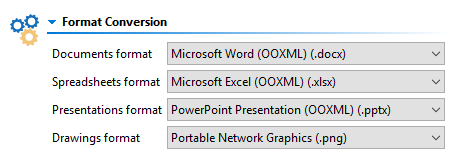
10.Select the Formatting options that were used for the migration.
Now you can either:
·generate the report immediately (by clicking the Next button).
OR
·schedule the report to run at a specified time.
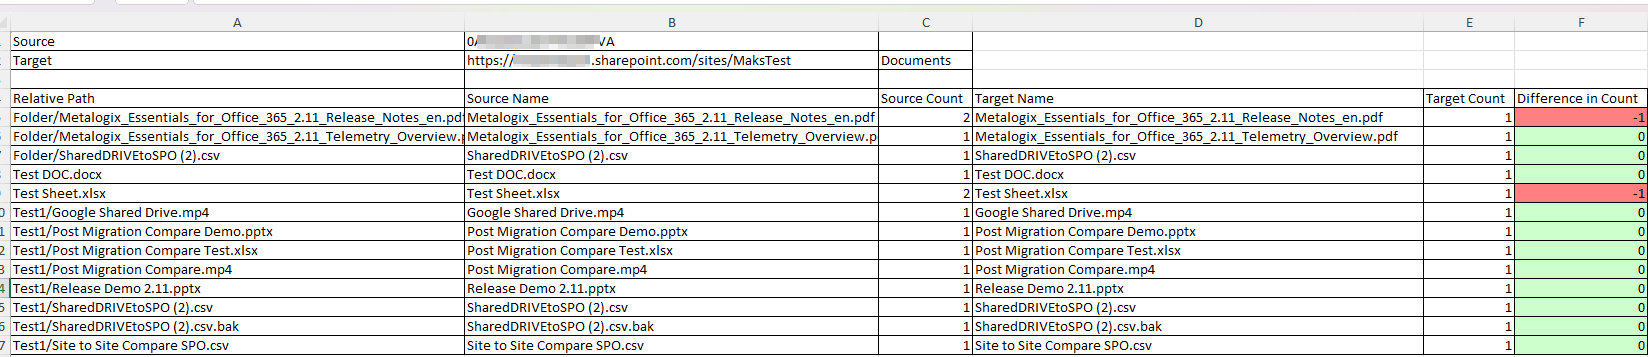
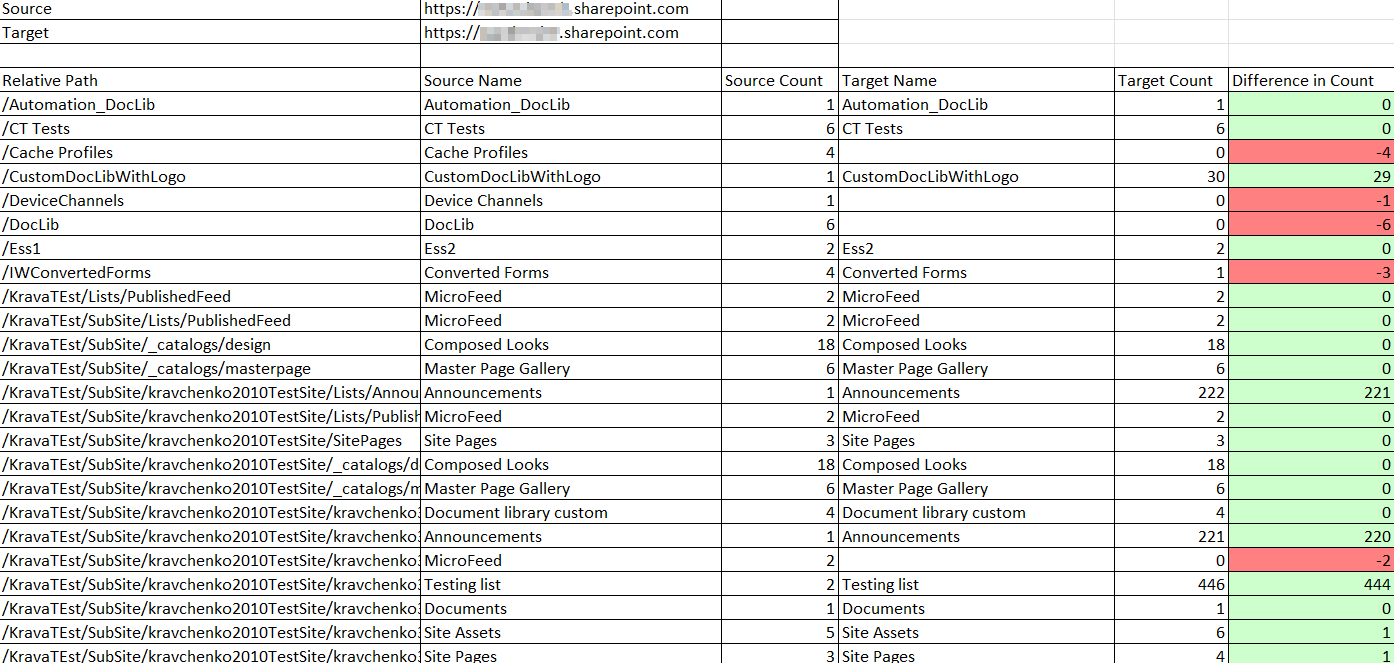
The report lists the count comparison between source and target for each object. If you are comparing content for multiple Shared Drives, each will display in a separate tab.
If you accepted the default configuration options, all source and target objects will be included in the report. All differences in count between source and target are highlighted in red.
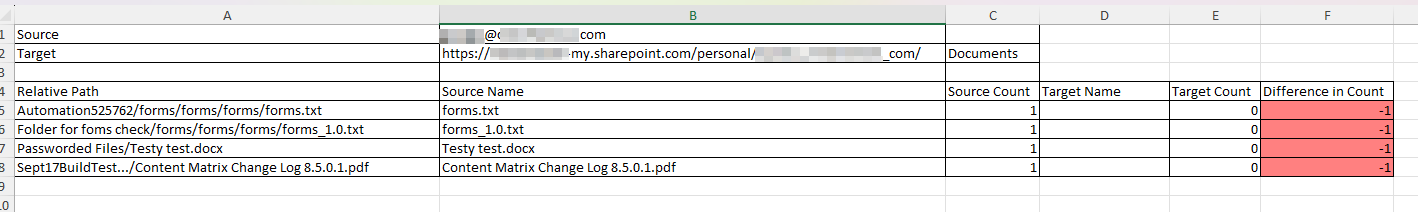
If you chose to Show differences only, objects with 0 Difference in Count are excluded from the report.
If you chose to Ignore target excess, only objects for which the count is higher on the source are highlighted in red.
Creating a CSV with URL Mappings
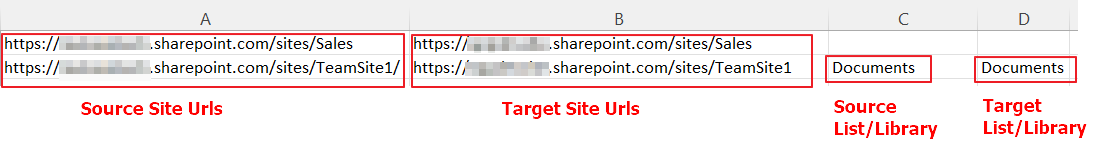
Before the Post-Migration Compare report can be run, a CSV file with source and target URL mappings must be created. The URLs can be at the site collection, site, or list/library level. The example below shows the proper CSV formatting for both a site-level and document library-level compare.
|
|
NOTE: If the mappings are incorrect or in the wrong format for the report, when you load the CSV file the message Mapping is incorrect will display in the UI. |
To perform a SharePoint Online to SharePoint Online Post-Migration Compare:
1.Once you have initiated a Post Migration Compare, enter a Project Name.
2.For Location and name for report, click the Select button, then select the name and location for the Excel output. (Essentials automatically adds the xlsx extension).
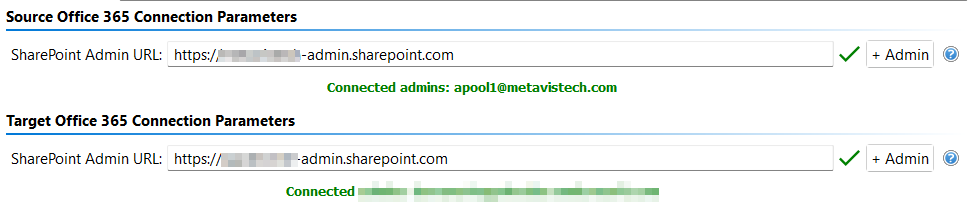
3.For Source Location, select SharePoint Online and connect to the Office 365 source tenant.
4.For Target Location, select SharePoint Online and connect to the Office 365 target tenant.
If the URL and credentials are valid, a successful connection message displays. You may also choose to add additional Admin account by selecting the "+Admin" button.
5.For Location and name for report, click the Select button, then select the name and location for the Excel output. (Essentials automatically adds the xlsx extension).
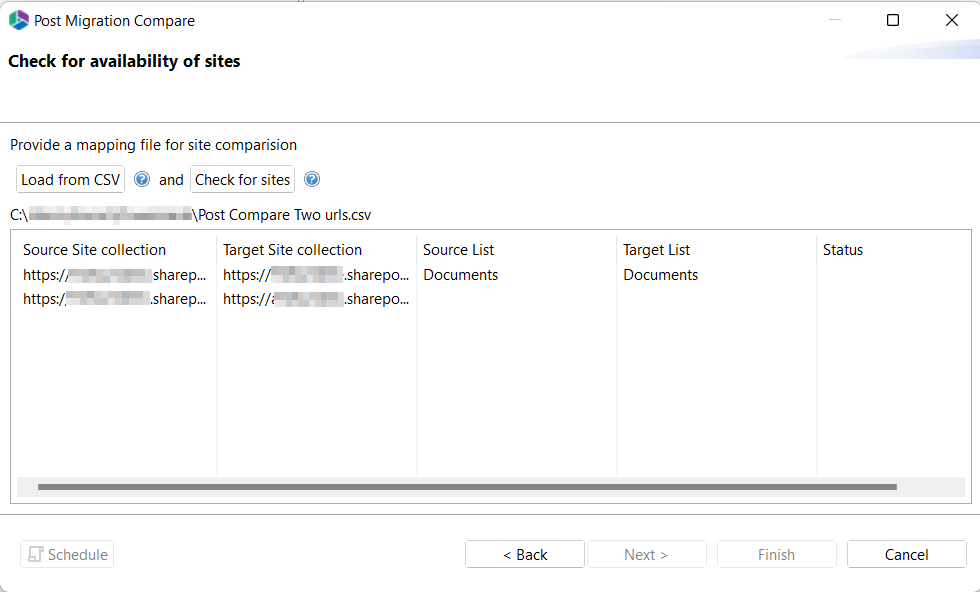
6.Click Next to display the Check for availability of sites dialog.
7.Click the Load from CSV button.
Essentials loads the mappings from the CSV file.
8.Click the Check for sites button.
Essentials retrieves the content for the mapped source and target.
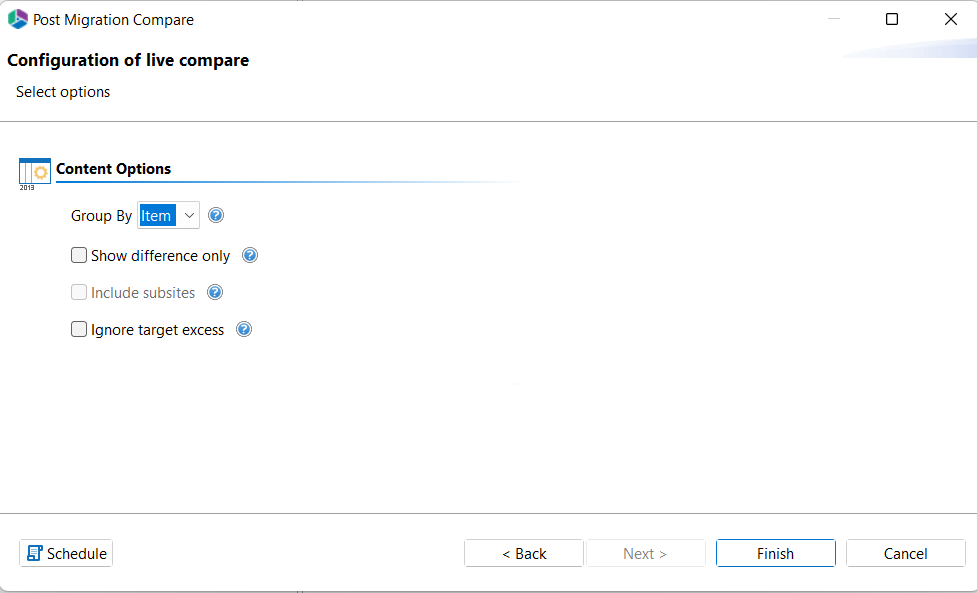
9.Click Next to display the Configure live compare dialog.
10.Select the Content Options for the report:
§Group By either List or Item.
§Show differences only: When this box is checked this box, the report will only show objects for which the count is different between the source and target. If you leave this box unchecked, the report will include all objects, regardless of whether the count is different.
§Include subsites: If there are no subsites to include, this option will be disabled.
§Ignore target excess: When this box is checked, only objects for which the source count is higher than the target count will be highlighted in red. If you leave this box unchecked, objects for which the target count is higher than the source count will also display in red.
Now you can either:
·generate the report immediately (by clicking the Next button)
OR
·schedule the report to run at a specified time.
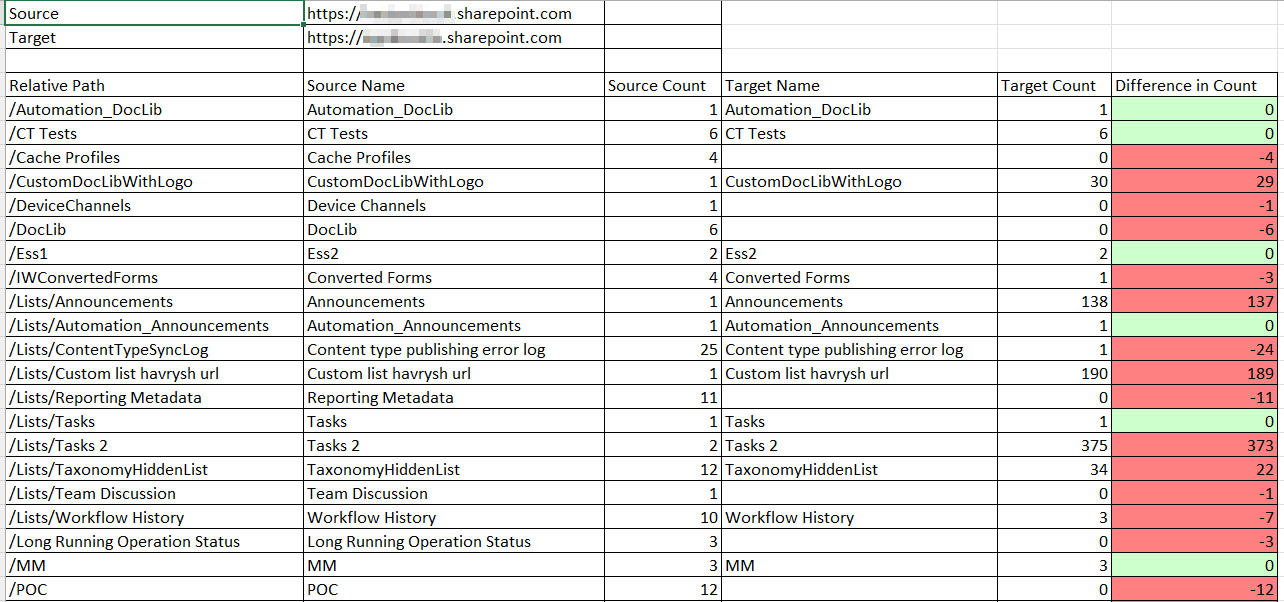
The report lists the count comparison between source and target for each SharePoint object. If you are comparing content for multiple source/target URLs, each will display in a separate tab.
If you accepted the default configuration options, all source and target objects will be included in the report. All differences in count between source and target are highlighted in red.
If you chose to Ignore target excess, only objects for which the count is higher on the source are highlighted in red.
If you chose to Show differences only, objects with 0 Difference in Count are excluded from the report.
Metalogix Essentials Security Manager for SharePoint is designed to analyze and manage permissions, groups/users and levels across multiple site collections and farms. It aims to both simplify cumbersome tasks and provide in-depth analysis of existing security rights from the convenience of your desktop and without installing anything on your SharePoint servers.
Metalogix Essentials Security Manager allows you to:
·Browse, add, edit and delete groups, users, permissions and permission levels in a visual hierarchical structure of site collections, sites, lists and individual items
·One easy to use interface for managing multiple server farms, domains and site collections.
·Copy groups, users, permissions and permission levels between server farms, site collections, sites, lists and individual items across user directories (LDAP, ADFS, RDBMS).
·Manage permissions for multiple objects at the same time
·Compare an objects permissions to better manage permission templates and identify where permissions do not match the templates
·Analyze a users or groups permissions for any site, list or item
·Analyze which users or groups have permissions for a specific object
·Discover and resolve potential security problems in multi-server farm environments such as sites with no permissions, deleted users with granted permissions, broken chain of permission inheritance, etc
·Transfer roles between users addressing issues such as employee turnover and new hires
·And much more
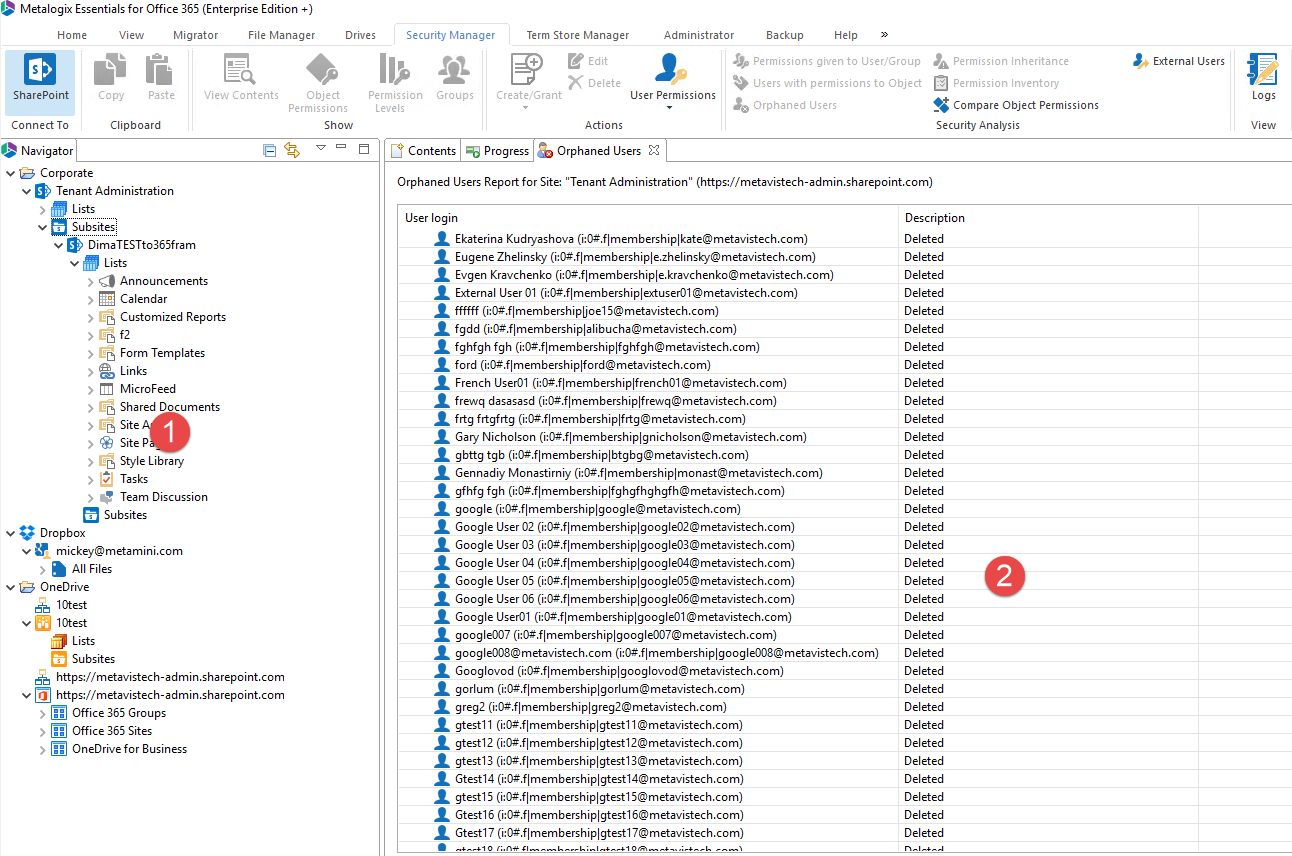
The application consists of two primary panes: (1) Navigator and (2) Contents/Objects Area.
The Navigation area is auto-generated when connecting to a SharePoint environment and provides a hierarchical representation of Farms, Tenants, Sites, Sub-Sites and Lists. The Content area contains screens in a tabbed structure that provide detailed information regarding the object selected in the Navigator pane.
|
|
NOTE: We have found this to be the ideal configuration, but the individual panes may be rearranged, minimized or maximized. |