Item Actions
|
|
Item Actions can be applied within Collection Views to apply an Action to an instance |
The following Item Actions are available in EA Agile:
Delete - Delete an Object Instance
Duplicate - Duplicate an Object Instance
Create - Create an object of any type with or without a relationship to the Object attached to the Item Action
Update - Add a button to update the value of an attribute to a pre-defined value
View - Navigate to another EA Agile View
OpenURL - Open the webpage of an object if it has a URL attribute
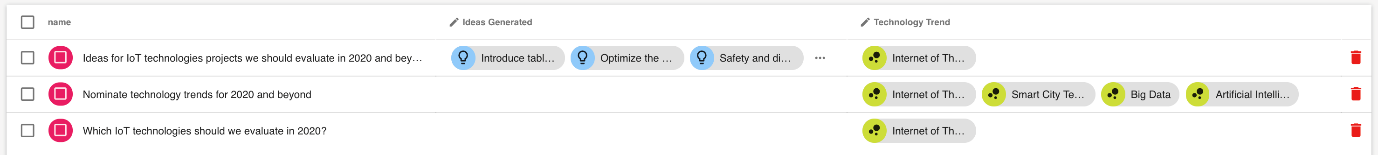
An example of a table with the 'Delete' Item Action
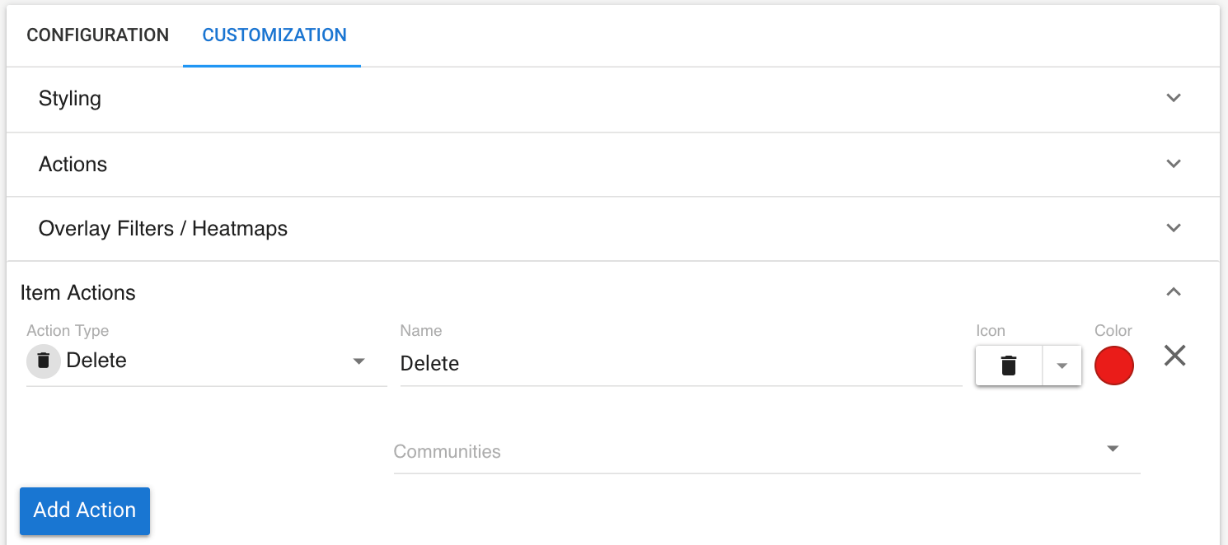
1. To add an Item Action to a View first go to the 'Customization' tab in View Configuration and open the 'Item Actions' Accordion
2. Click 'Add Action' and select your Action Type
Diagrams
Diagram Views
Building a diagram from model content
|
|
Diagrams can be built directly from the underlying model. |
As with any other view of the model such as a roadmap or pivot table, the diagram can be rendered by the user.
Each diagram type is pre-defined with the object types and relationships that the diagram supports.
A diagram can be given a name, type and description.
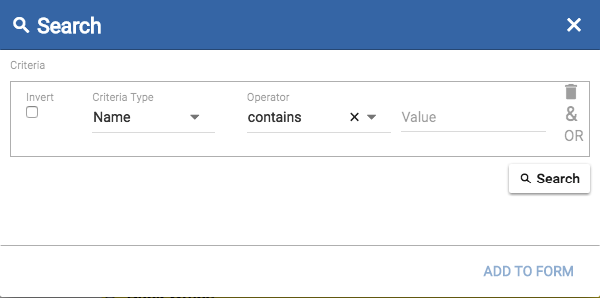
To modify the diagram contents, users can use the search function to create queries and find objects within the model - these can be simple, such as 'Name contains claim', or be more complex with multiple query rules defining the dataset the user is looking for. Multiple searches can be performed to complete the dataset.
Multiple types can be added using the Search function, each type will be shown in the 'Dataset' section.
Objects that appear in this section will appear on the diagram. The checkbox will allow you to remove the object from the diagram.
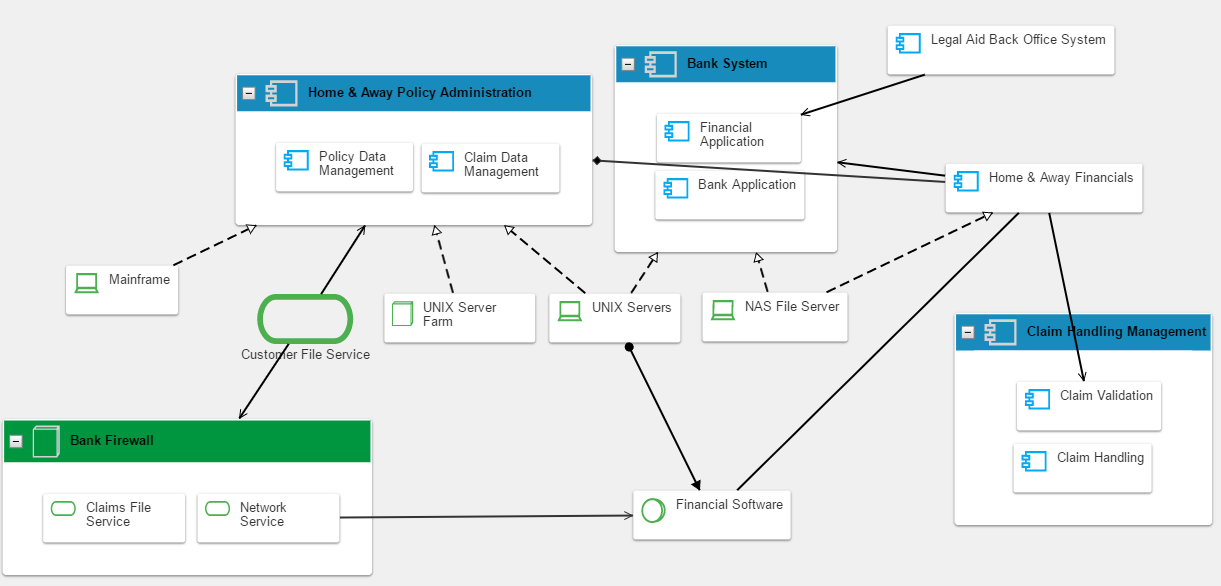
Once complete, select the Diagram tab at the top of the page, and the diagram will be drawn automatically from the objects in the Dataset.
Box in Box relationships
Any relationship can be represented in box in box style.
Right hand mouse clicking on any relationship on a diagram will provide a 'Represent as Box' option. Each object that is at the ends of the relationship is presented. Choosing one of these will make it the parent box.
|
|
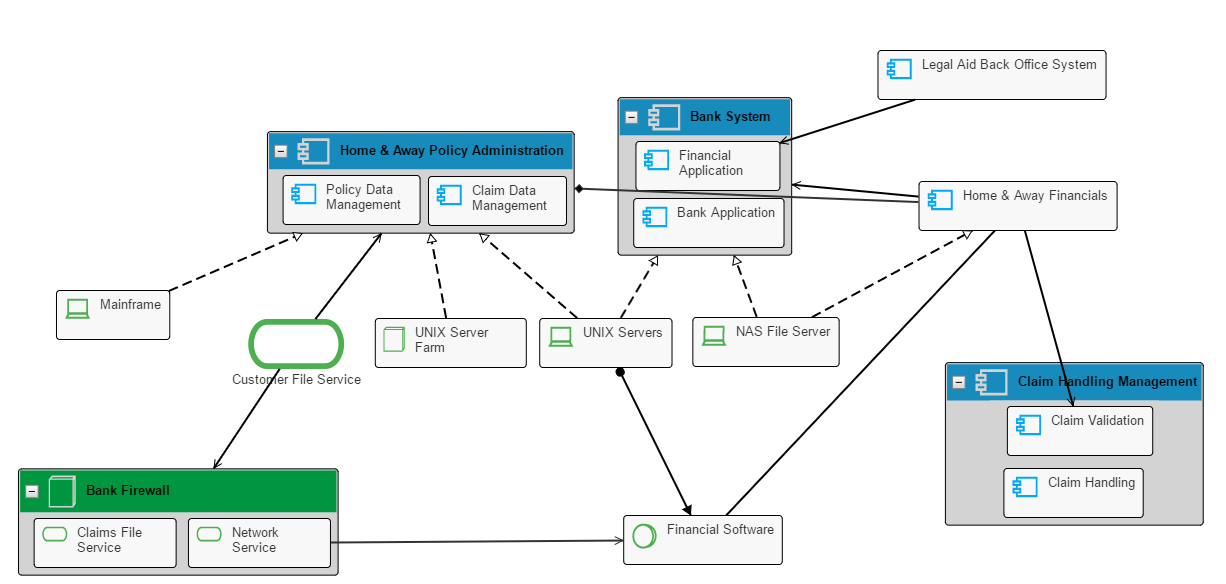
You may also add multiple relationships to a single parent by selecting relationships connected to different 'child' objects and using the right hand mouse option. |
Right hand mouse clicking on the child object will allow you to remove that node from the group (Remove from Group).
For adding many related objects inside or outide of the box, please see here
Box Resizing
As default, boxes are resized by moving the nodes within them, the maximum size of the box is bound by the position of its child nodes. However, there maybe occasions when you would like to resize the group box to a bigger size for aesthetic purposes.
You can simply select the box and then drag the edges to the size you want.
This will allow you to drag the boundary to a minimum size. The parent box will never shrink below the size you resize it to.
You will also notice other options around resizing and colorizing available from the right click menu.
Node v Box Representations
You may also use the right hand mouse click to convert shapes to small, big or box style.
Hide/Reveal Relationships on diagrams
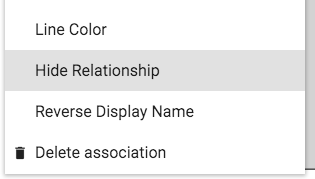
You may hide a relationship on the diagram by right hand mouse clicking on the relationship.
This will hide it on the diagram view but will not remove it from the model.
You can hide the selected relationship on the diagram. This will give the relationship a ‘state’ of hidden.
A relationship will also be set to a state of hidden upon being 'deleted' on the diagram.
Hiding relationships is useful if you want to focus on the other relationships when discussing models with stakeholders.
The diagram has a menu to display relationships according to their ‘state’ - right click on an empty space to see this.
Select Display.
Then Relationships.
You can use this menu to show All relationships, Visible relationships only, or Hidden relationships.
You can return a relationship's state to 'visible' by displaying hidden relationships, right clicking the relationship, and selecting "Show Relationship".
Drawing
Users can draw symbols and lines onto the surface of diagrams to create or modify views of the model and the underlying model itself.
To initiate the drawing palette, simply create a new or open an existing diagram, and the toolbar will be shown on the left hand side.
The symbols available to you will be filtered to the assigned object types for the diagram type.
Drawing Basics
Press the expand button to see the drawing pane.
Select a symbol type from the drawing pane.
Drag the symbol type onto the diagram.
Notice the 'New' flag that displays the status of the symbol - this will disappear, either when the symbol is named and the diagram is saved, or an existing object is chosen for this symbol.
When the symbol is first introduced to the diagram, it will expect a name to be entered, otherwise double-click the symbol to enter a name.
As a name is entered, a filtered list will be displayed, of all objects of the selected type that have names that contain the entered characters.
Either;
continue to type a new name to create a new object, or
select an existing object from the list.
Add one or multiple existing objects to a diagram;
Right click empty space on the diagram
Select insert > Existing Objects

Search for the objects you would like to add. This is the same as any other search in the platform.
To relate objects on the diagram:
Select a symbol. This will display a circle containing a 'link' icon.
Click the link icon, and drag the relationship line to the 'target' symbol - both symbols will be highlighted.
Release the mouse and the relationship line will be drawn.
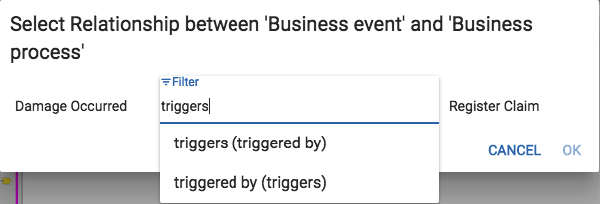
Once the relationship has been drawn, a screen will be displayed allowing you to select the type of relationship.
Choose the relationship type for this line symbol, you can type to search for the name of the relationship you wish to use.
Select the OK button.
If no Select Relationship screen is displayed, there may be only one type available between the two symbols, and this has been applied.
When this relationship type is selected and the diagram is saved, the relationhip is also created within the model.
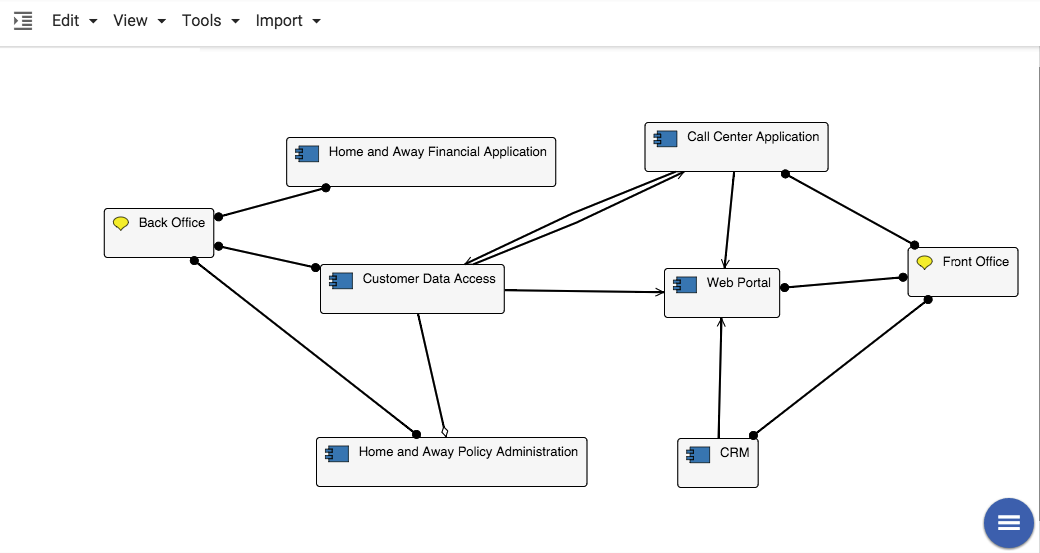
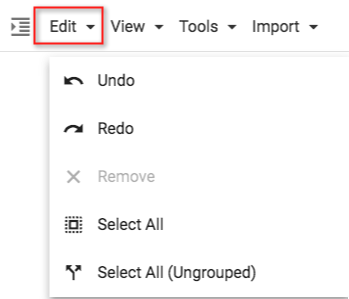
The menu bar contains Edit, View, Tools, and Import menus:
Edit - Provides options to Undo/Redo changes, Remove objects and Select All symbols.
View - contains options to scale the diagram. The "Zoom To" submenu contains preset values such as 100% and To Fit.
The Grid Settings submenu has a Snap To option that will make aligning symbols easier. (See more detail below.)

If multiple node symbols have been selected, the Layout Settings submenu provides Align Selected Nodes By and Space Selected Nodes options.
Aligning Nodes
Multiple symbols can be aligned based on their Tops, Bottom, Left, or Right sides.
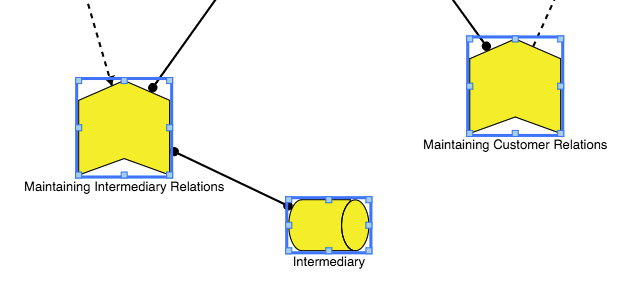
In the example diagram extract below;
Tops, would move the "Maintaining Intermediary Relations" and "Intermediary" symbols up, to align with the top of "Maintaining Customer Relations".
Bottoms, would move the "Intermediary" and "Maintaining Customer Relations" symbols down, to align with the bottom of "Maintaining Intermediary Relations".
Aligning symbols on their centres is best achieved by enabling the Snap To option.
Spacing Nodes
Multiple symbols can be spaced apart or separated by the same amount of space, in rows or columns.
The first symbol selected will not move, while all other selected symbols will be spaced to the right or below this symbol.
Grid Settings - the Grid Settings submenu can be accessed from the View menu.
The Grid can be displayed, its 'size' set to a different value, and symbols can be moved to snap to the grid.
You can also change the overall styling of a diagram using Diagram Styles, this can be selected from the view menu and there is two options to choose from, standard or traditional.

Standard Style
Traditional Style