Auto-Generated Diagrams
How Do I Create Auto-Generated Diagrams?
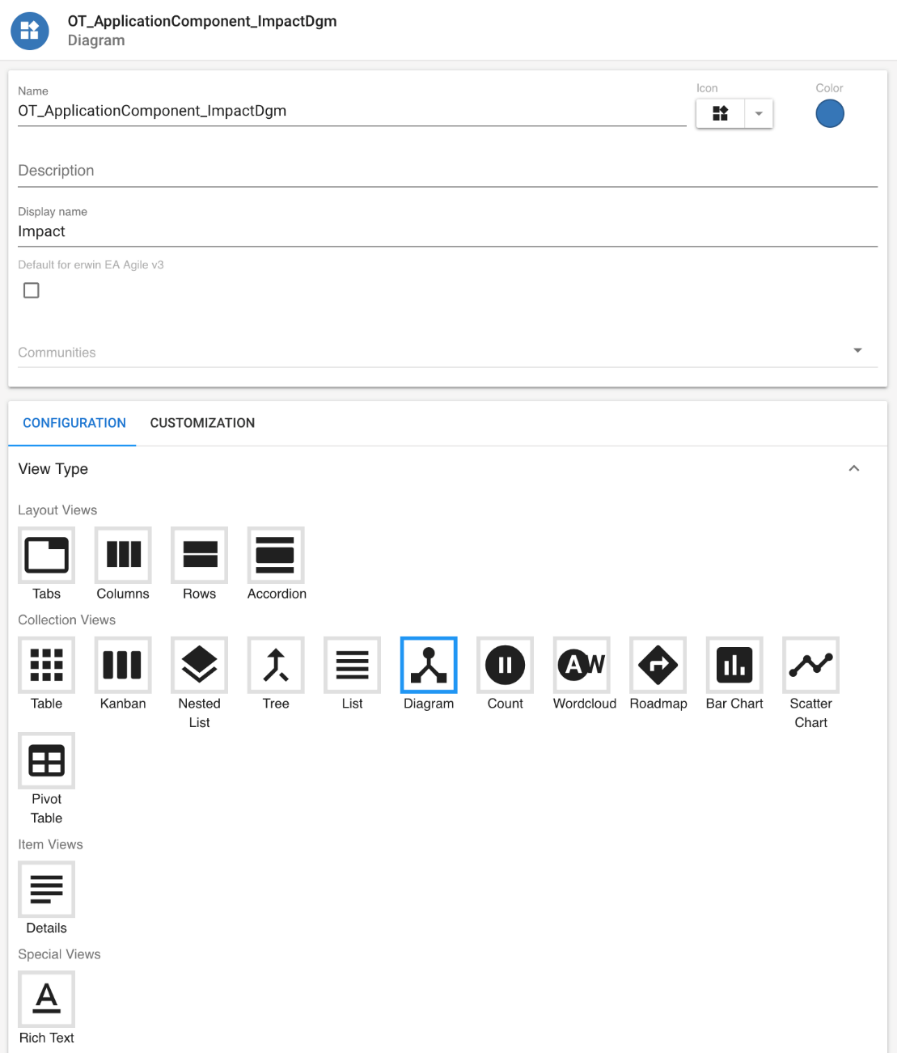
Auto-Generated Diagrams create visual representations of a pre-configured metamodel journey whilst taking in the context of an object you are viewing. For example, the diagram below takes context from the Application that is selected then automatically creates a diagram based off of the users.
1. First, select Diagram from your list of Collection Views
2. Auto-Generated Diagrams use Journeys to define their structure.
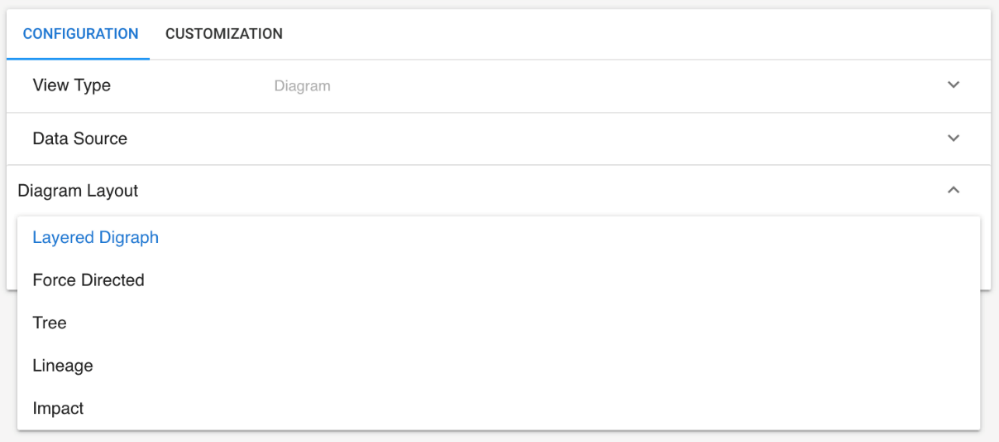
3. Finally, select the layout style for your diagram
Radar Charts
How Do I Create a Radar Chart?
There are two types of Radar Charts available to users in EA Agile v3. The first 'collection' is used for multiple object instances. The second 'item' is used on a single object instance.
As a Collection View
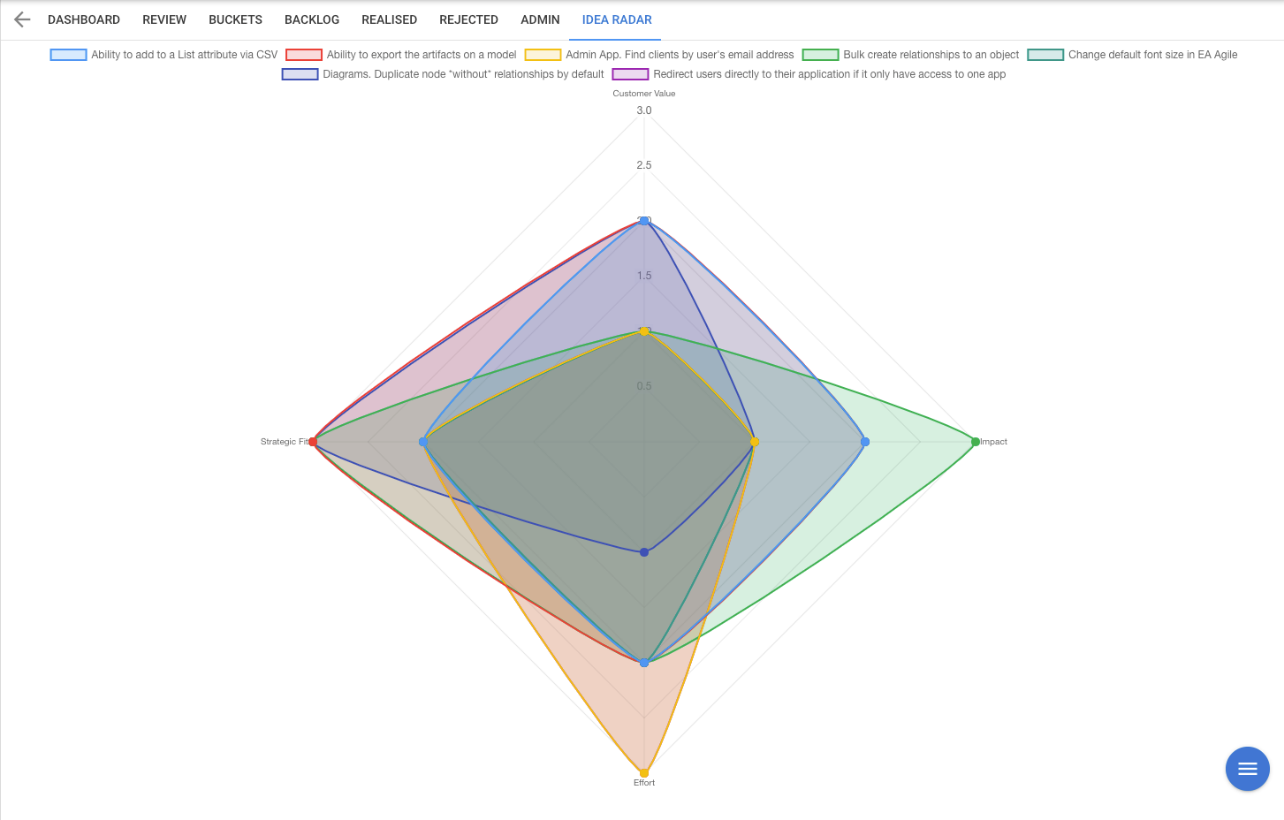
Figure A. Example of a Radar Chart analyzing multiple
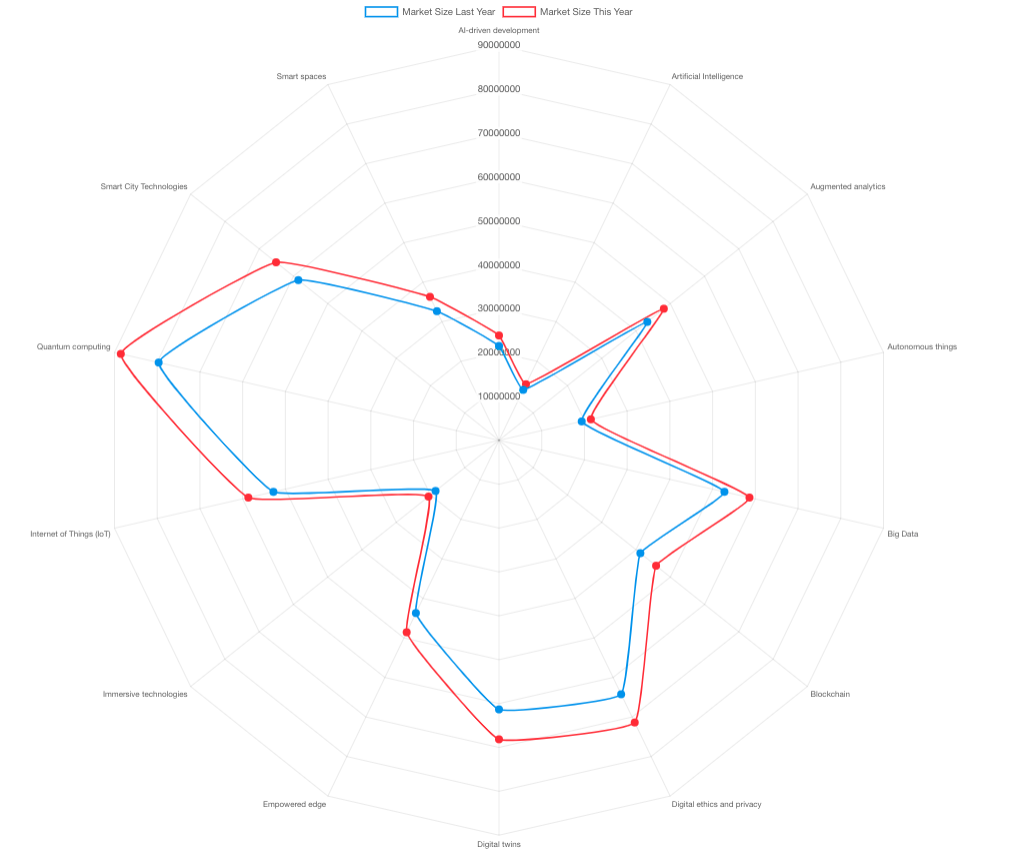
Figure B. An example analyzing two attributes
|
|
Before starting you must read and follow the instructions in the New View help page. |
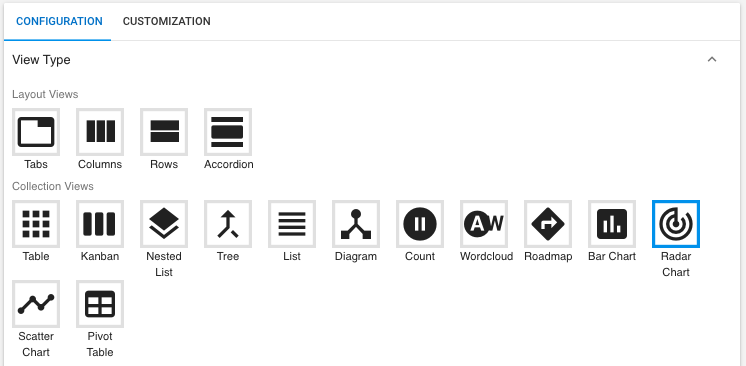
1. Select 'Radar' from Collection Views
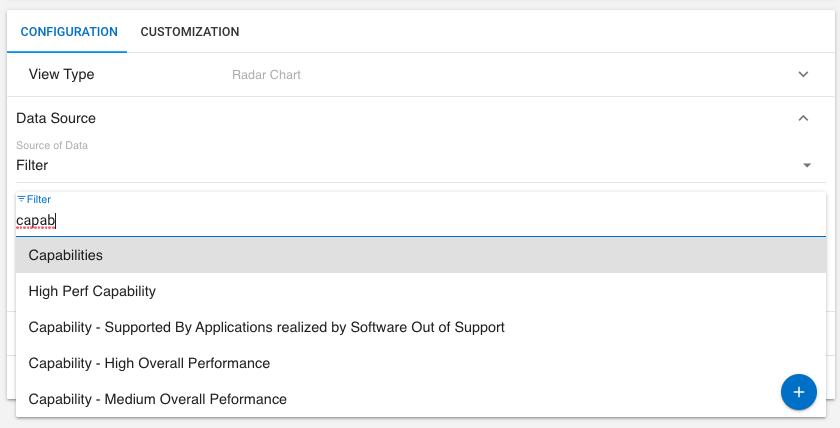
2. Add a Filter so your list only displays the instances you require. You can either select a filter or create a new one (For more on how to create a filter please visit the Filters help file)
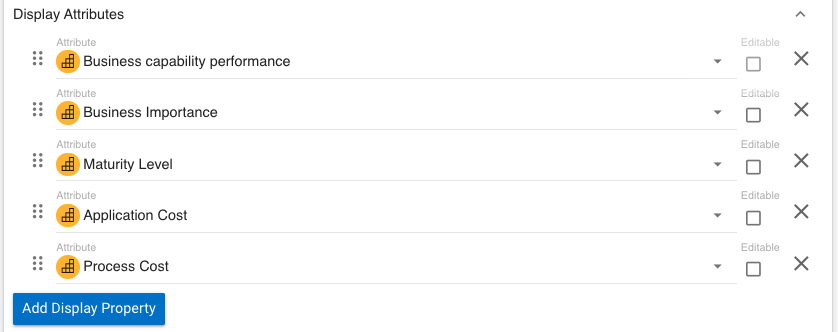
3. Next, select your Display Attributes (Axis). These can be Arrays, Integers or Numeric Roll-Ups.
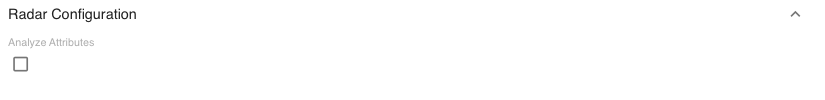
4. Finally, select your display style. Selecting 'Analyze Attributes' will make the Display Attributes subject to comparison (see figure B at the top of the page)
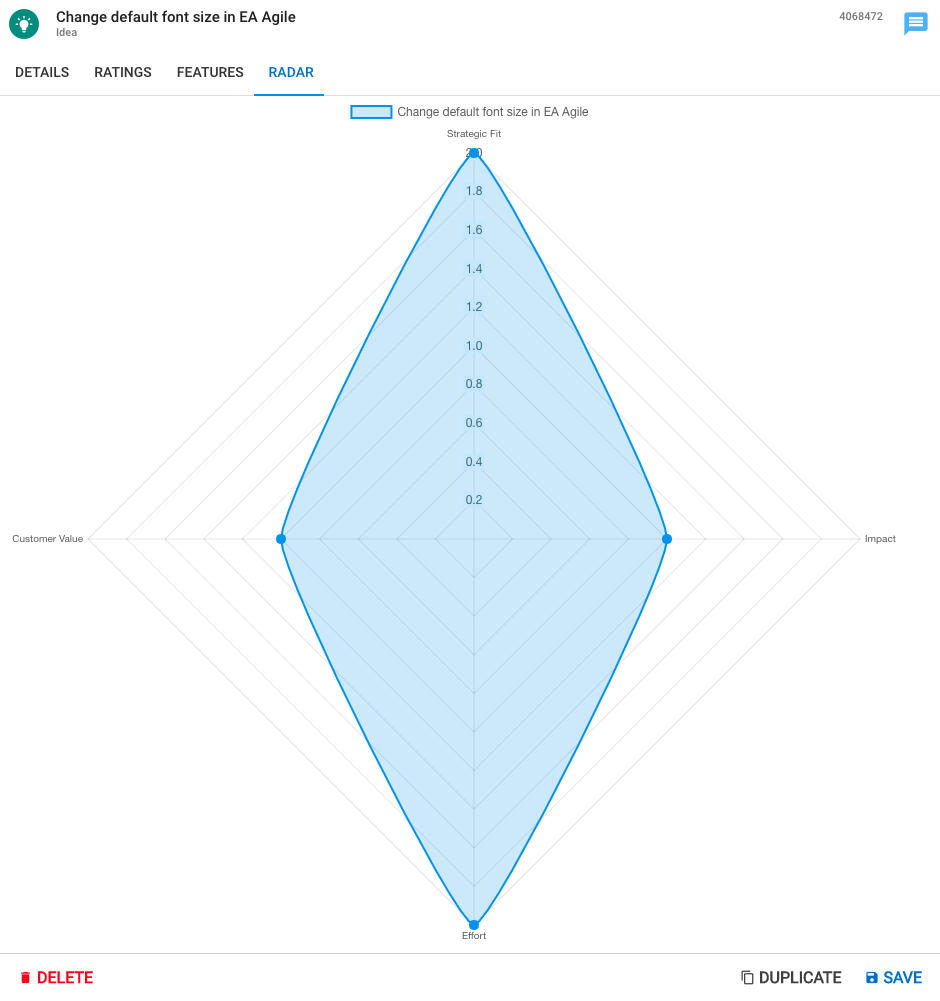
As an Item View
An example of a Radar Chart used as an Item View
|
|
Before starting you must read and follow the instructions in the New View help page. As an Item View this Radar Chart is designed to compare attributes of a single object. Therefore there is no Data Source required and configuring only requires two steps. |
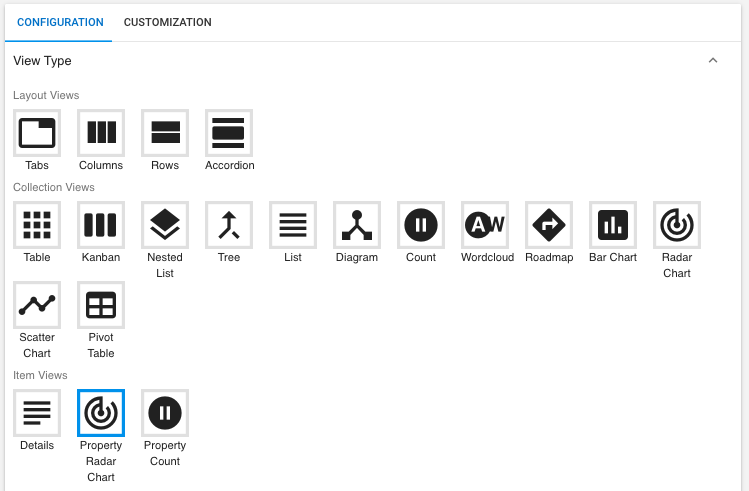
1. Select 'Property Radar Chart' as your View Type
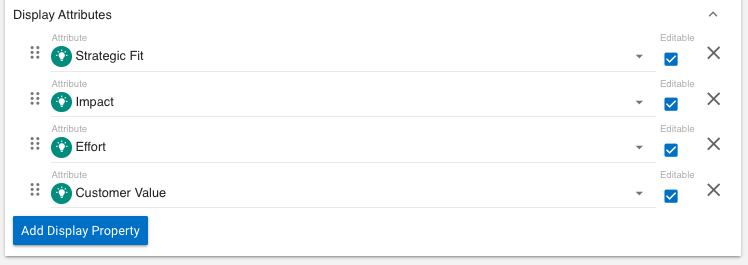
2. Next, select your Display Attributes (Axis). These can be Arrays, Integers or Numeric Roll-Ups. A filter is not required as this is an Item View so will take Context from the object selected.
3. Finally, click 'Save’
View Customization
How Do I Create a Heatmap?
1. When configuring a View click on the blue ‘Add Heatmap’ button
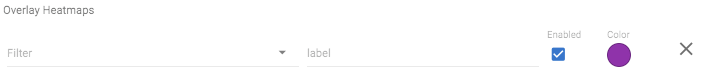
2. This will bring up a blank Heatmap form
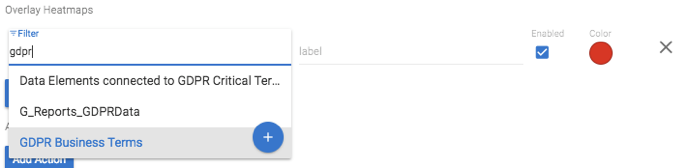
3. Next, select the filter you wish to use for your Heatmap
a. You can either select a Filter that is already in the system or create a new one by clicking the blue + button
|
|
For more on how to create a Filter click here |
4. In ‘Label’ enter the display name for your Heatmap, if left blank the filter name will be used
5. If you wish for your Heatmap to be automatically enabled, make sure the ‘Enabled’ checkbox has a tick in it
6. Finally, choose the color you wish to use for your heatmap
|
|
To add another Heatmap simply click ‘Add Heatmap’ and repeat Steps 2 – 6 |