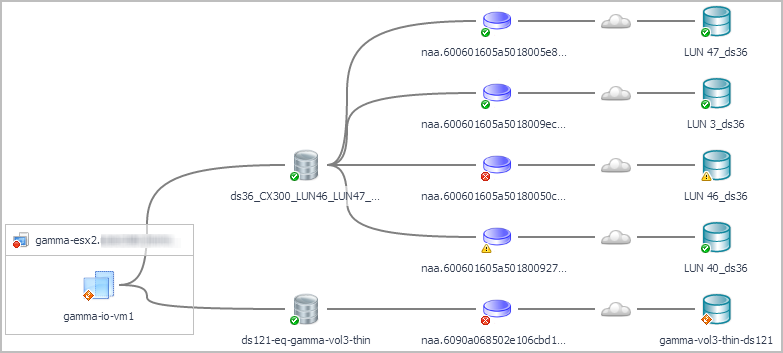
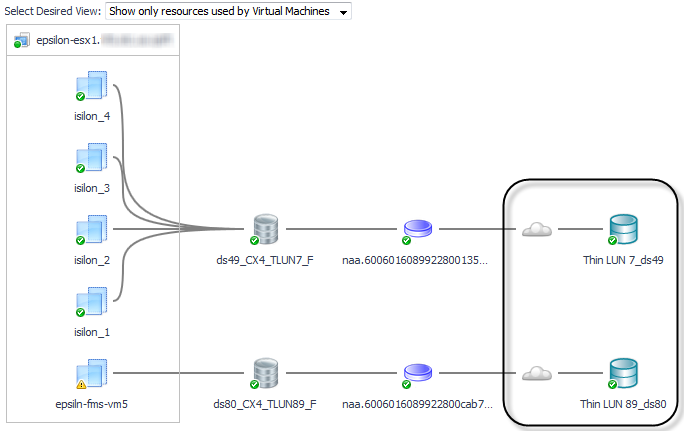
Foglight for Storage Management provides comprehensive topology views which detail all I/O paths and components on each I/O path from VMs down to their assigned physical storage devices. These views assist in determining where actual performance or connectivity problems are occurring during I/O requests, something which is not possible using traditional virtual infrastructure management tools. For more information, see Assessing Connectivity and I/O Performance.
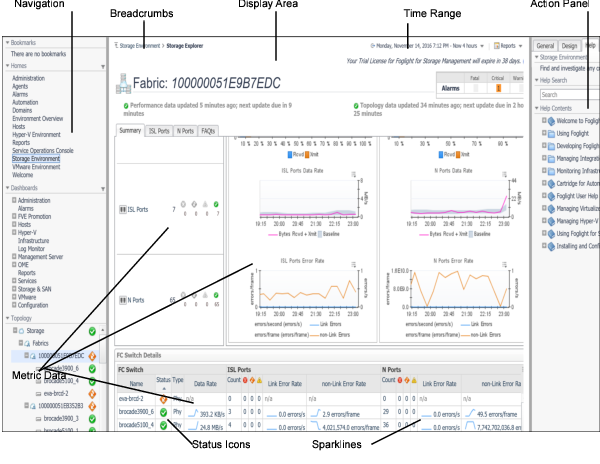
Foglight for Storage Management is built on the Foglight platform. The following diagram and table introduce the common Foglight for Storage Management screen elements that are used in Foglight for Storage Management dashboards. If you need more information about how to use these elements, open the online help and navigate to Foglight User Help > Getting Started > Working with Dashboards.
|
Shows the trend of a metric in a small space. The value beside the sparkline is the current value for the metric in the selected time range. When used in a table, sparklines provide an easy way to compare spikes or other trends in a group of metrics. Click a sparkline to plot all data points for the time period on a graph. | |
|
Displays the status of a storage resource. For more information, see Understanding Status, Alarms, and Rules in Foglight for Storage Management. |
|
NOTE: This procedure is intended for Foglight for Storage Management users with the roles of Storage Administrator, VMware Administrator and Hyper-V Administrator. |
|
1 |
Open a supported browser. For a list of supported browsers, see the System Requirements Guide. |
|
4 |
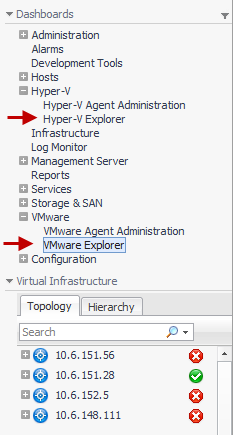
On the navigation panel, expand Dashboards. |
|
5 |
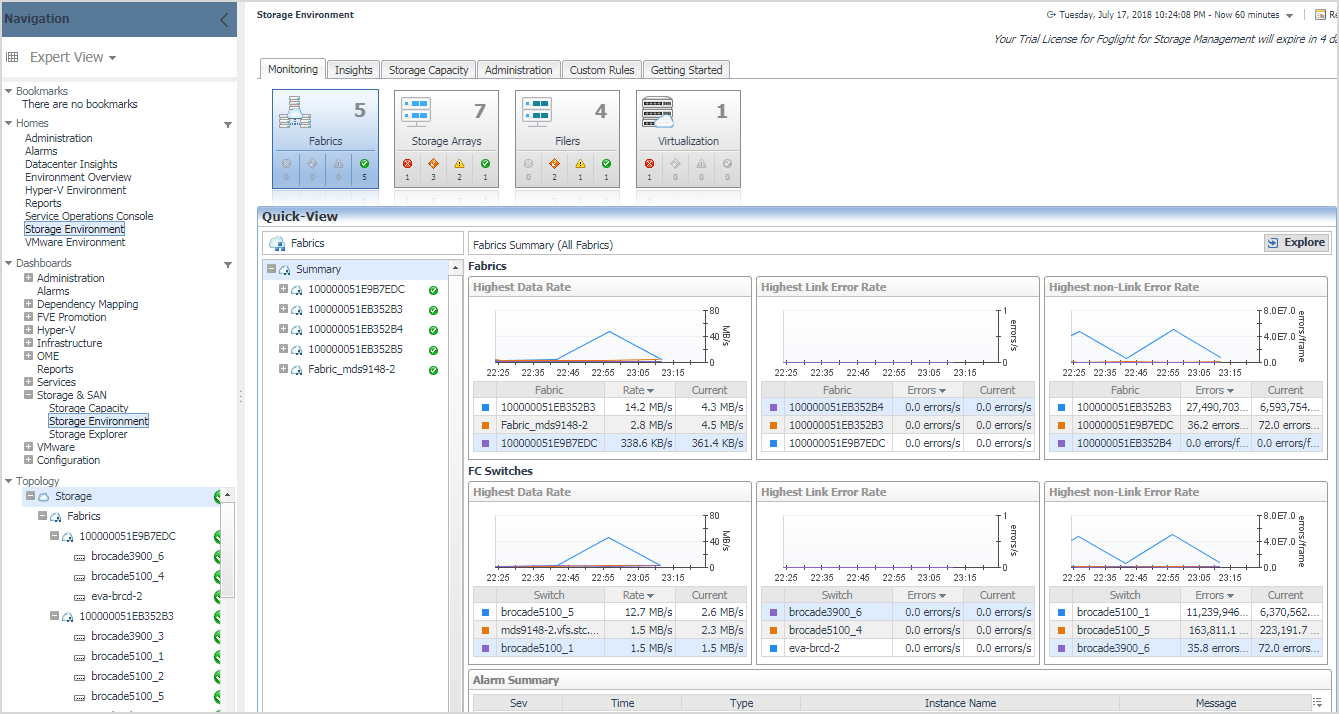
Expand Storage & SAN. |
|
6 |
Click Storage Environment. |
|
7 |
Ensure the Monitoring tab is selected. |
|
a |
|
TIP: If you do not see the Administration tab, ask your Foglight for Storage Management Administrator to add the role Storage Administrator to your user account. |
|
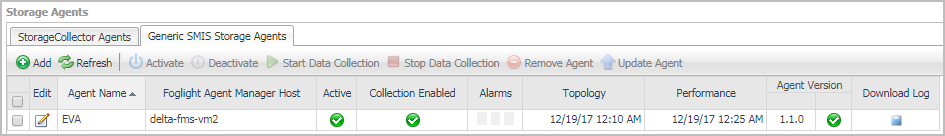
b |
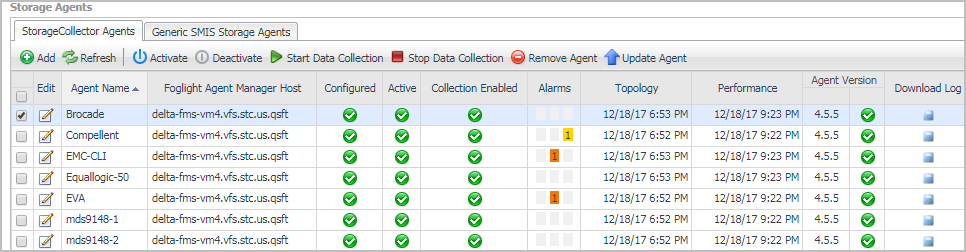
In the Storage Agents > StorageCollector Agents list, look for the Storage Collector agent that monitors the missing device or device type. When an agent monitors a device type, click the Edit icon to view a list of named devices in the Edit Agent Properties dialog box. |
|
a |
Click the Hyper-V or VMware Explorer. |
|
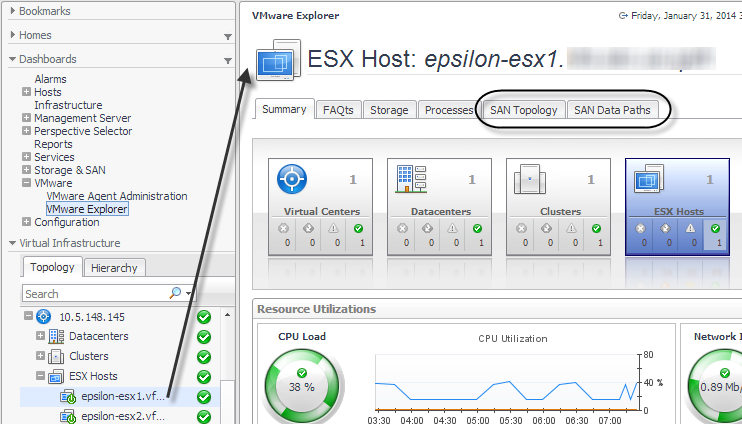
d |
Click the SAN Topology tab. |
|
3 |
On the navigation panel, click Infrastructure. |
|
a |
In the Select a Service box, select All Hosts. |
|
b |
Click the Inferred tile. |
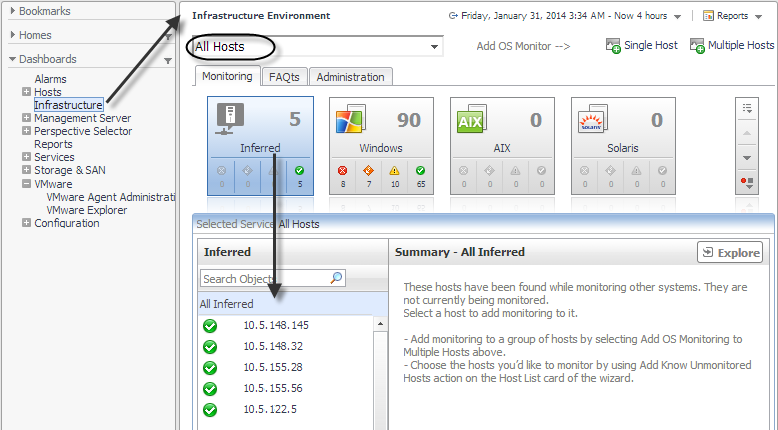
|
c |