Chat now with support
Chat with Support

Foglight for Microsoft DOT NET 5.9.13 - Application Servers User Guide

Monitoring Application Servers Monitoring Systems Monitoring Servers Monitoring Deployed Applications Monitoring Requests Managing Traces Using Object Tracking to Locate Memory Leaks Monitoring Methods Application Servers Monitor Views
JVM view Method Groups view Request Types view Entity EJBs view Message Driven EJBs view Stateful Session EJBs view Stateless Session EJBs view Deployed Applications view JSPs/Servlets components view Resource Adapters components view Web Applications components view Web Services components view .NET views JBoss Services views Oracle Services views Tomcat Services views WebLogic Services views WebSphere Services views JMX Administration dashboard JMX Explorer dashboard
Appendix: Regular Expressions

Examining the structure of Application Servers services

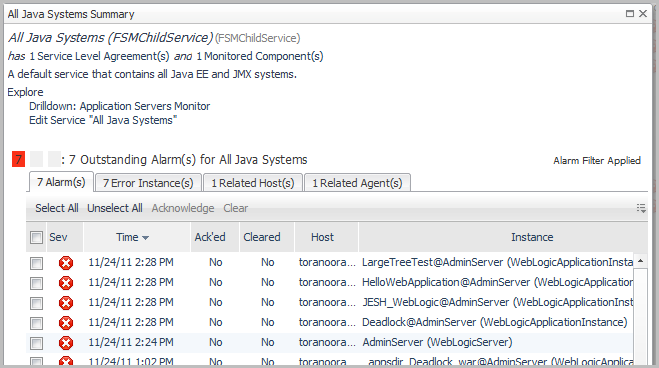
The Application Servers service category includes the All .NET Systems service, and the All Java Systems service, each of which in turn can be comprised of one or more services. For example, the All Java Systems service could include the following services:

Each service has components or sub-components that are monitored by a rule.

A component has its own alarms and Service Level Compliance (availability) status. The status of each component rolls up to provide an overall Service Level Compliance and alarm status for a service. From the Service Builder dashboard, you can explore how a service is built. You may want to examine this composition to see which components are contributing to the poor health.

2
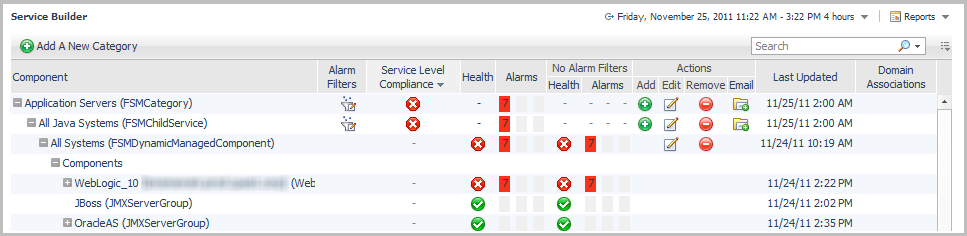
Expand the Application Servers service category. The grouping underneath the service category appears.
1
Select the All Java Systems service.
2
Under the Explore heading, click Drilldown: Application Servers Monitor to view the details of the service in the Application Servers Monitor dashboard.

For more information about Services and Service Level Agreements, see Monitoring Your Services in the Foglight User Guide.


Monitoring Systems

The Systems and Servers views of the Application Servers Monitor dashboard are common to Foglight for Microsoft .NET, Foglight for Java EE Technologies, and Foglight for JMX. This section describes the features and functionality of these two views, and the related Java Virtual Machine (JVM) view.

The Systems tile provides a high-level overview of the behavior of your systems. Use this view to review groups of monitored domains, cells, cluster topologies, and partitions. From here you can quickly see the number of servers and deployed applications being monitored, their health, availability, and more.

Select an object in the system summary table to view the components that belong to that system, such as servers and deployed applications. When you hover over a component, a dwell displays all its sub-components and any alarms associated with that system.

From this view, you can perform the following actions:

1
On the navigation panel, under Dashboards, click Application Servers > Monitor. The Application Servers Monitor dashboard opens.
2
Click the Systems tile.

Systems

The Systems table lists all the systems running in your monitored environment. This table can also list the total number of, and availability for, monitored servers and applications in your infrastructure, depending on the columns shown.

Use this table to quickly review the overall system health, and to determine if an error is occurring at the server or application level. Colored icons indicate the health status of the components: green check marks or upward arrows indicate a healthy state, while the red X or downward error indicates an alarm condition. A yellow caution triangle (not shown) indicates that the system is in a warning state and may become unhealthy.

Select a system from the list to populate the System details view with data about the servers, applications, domains, cells, cluster topologies, or partitions in the selected system.

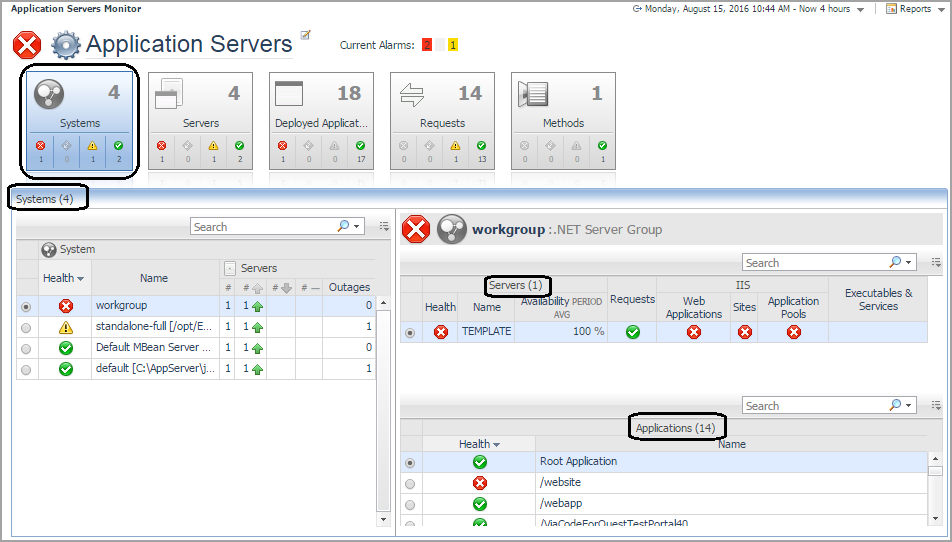
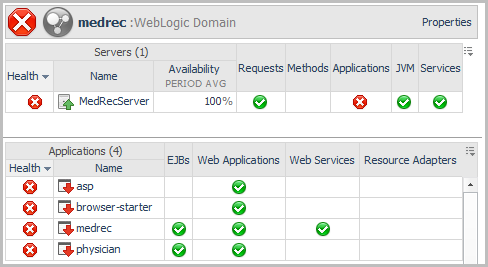
For example, the health of a WebLogic_10 system is poor (), because one server and six applications are unavailable (
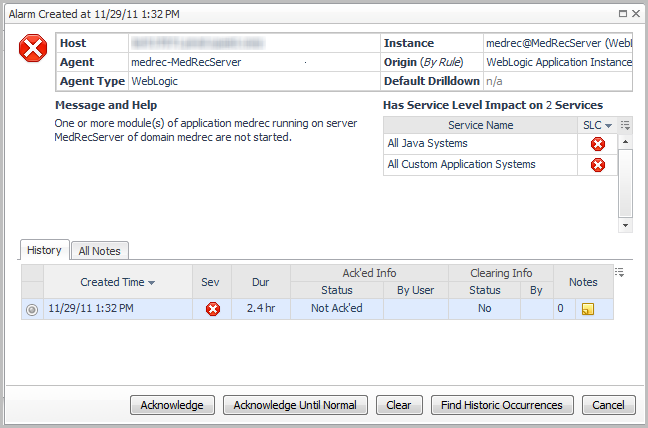
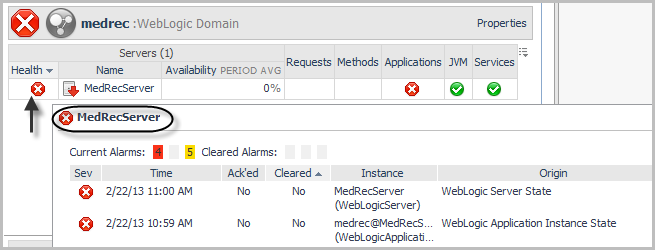
). Click the status icon for an affected component (system, server, or application) to obtain information about the source. For more information, see Reviewing the health of your systems.

The system details view displays details of the system selected in the System table. Depending on the type of system selected, this view may be divided into two tables: the Servers table (upper right), and the Applications table (lower right). For some systems, the Applications table is not applicable and is therefore hidden.

To review the properties for the selected system, click Properties (at the top right corner of the Systems Details view). The information available in this pop-up depends on the type of system selected.

The Servers table lists the monitored servers for the selected domain, and provides you with at-a-glance health information for the server and any monitored components. Click any entry to access several different drill-down views associated with the components.

The columns in this table dependentd on the cartridges you have installed and the components you are monitoring. For example, for a system monitored by the JMX Agent, the Servers table includes MBeans and JVM status columns, and the Applications table is not available.

The Applications table lists all the applications running in a particular domain, cell, cluster topology, or partition and the status of related components such as EJBs, Web Applications, Web Services, and Resource Adapters. Click any entry to access drill-down views that provide detailed information about the selected component.

For more information, see Reviewing the health of your systems.

Related topics:

Reviewing the health of your systems

You can obtain at-a-glance information about the health of a domain, cell, cluster topology, partition, or server group, and quickly assess the health of components and sub-components, from the Systems view of the Application Servers Monitor dashboard.

1
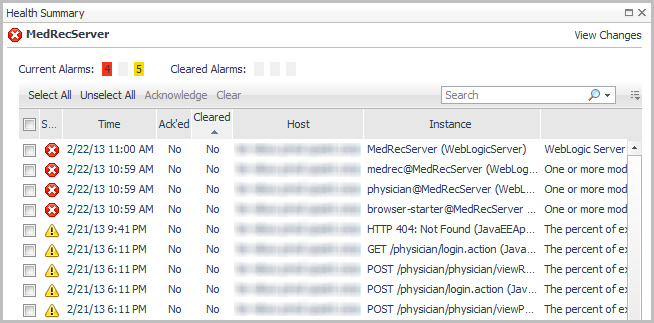
In the Applications column of the Servers table, click the health status icon.
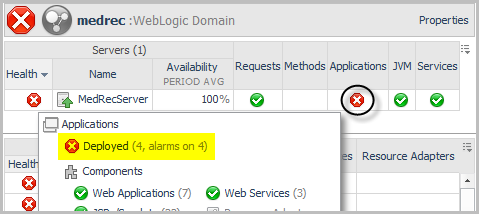
2
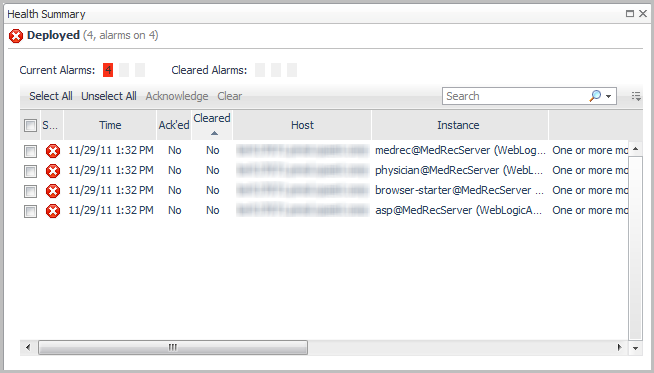
Click the Deployed health status icon.
Related Documents

The document was helpful.

Select Rating

I easily found the information I needed.

Select Rating