The results of any object tracking requests for Foglight for Java EE Technologies are listed on the Object Tracking tab of the Java Virtual Machine (JVM) view.
Review the Live and Expired values. Classes with a large Expired value should be considered for investigation.
|
This column is checked if the class is directly tracked. Classes that are directly tracked are those specified in the ObjectTrackingClasses property in agent property file. Classes that are not directly tracked are allocated by directly tracked classes, but these classes are only tracked when allocated by a directly tracked class. | |
|
State of the class health. You can click the icon in the Health column to obtain alarm information. | |
|
1 |
On the Object Tracking tab of the Java Virtual Machine (JVM) view, select a class in the Object Tracking table. |
|
2 |
Click Track Per Request Type. |
|
3 |
Click Enable. |
|
5 |
Click the name of the class (in the Class column) to review a list of request types that allocate the object of the class. |
After your administrator has configured the named methods to monitor (see Collecting metrics on Java methods ), you can use the Methods view to investigate how often a named method is called and to monitor the results of those called methods. For example, you can use Named Methods to monitor specific methods that connect to external systems.
The Methods view shows you detailed information about the named methods being monitored in your environment.
From this view, you can perform the following actions:
|
1 |
On the navigation panel, under Dashboards, click Application Servers > Monitor. |
|
2 |
On the Application Servers Monitor dashboard, click the Methods tile. |

|
NOTE: Restart your instrumented application servers after editing the instrumentation configuration (agent/instrumentation.config) in order for the changes to take effect. |
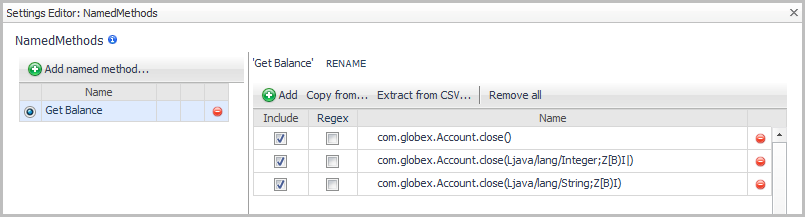
You can group overloaded methods together. In the example below, we are defining a method group which uses similar methods. Get Balance is displayed in the user interface and all the methods within that group are aggregated.
|
1 |
|
3 |
On the Java Administration page, click the Agent Configurations tab. |
|
b |
|
d |
Click Copy. |
|
e |
A message box opens. Click Close. |
|
6 |
Select Edit instrumentation settings. |
|
7 |
Click the Named Methods tab. |
|
8 |
Click Edit |
|
9 |
In the Settings Editor, click Add named method. |
|
11 |
Click OK. |
|
12 |
Click Add to add a row to the method list table. |
|
13 |
Click in the Name box and type the name of the method. |

|
IMPORTANT: These settings are valid only for FullDetail and ComponentDetail Instrumentation Levels. Changing the values has no effect if the Instrumentation Level is BasicDetail or NoDetail. You can set the instrumentation level on the General page of the Configuration Category Editor for the agent instrumentation profile. |
|
16 |
Click Save. The Configuration Category Editor closes. |
Although the NamedMethods MethodList accepts a broad package definition, it is not recommended that you define your NamedMethods this way. Excessive NamedMethod instrumentation may increase the load on the Foglight Management Server and overhead on the application server, so it is best to include only the methods that you are interested in. To guard against excessive instrumentation, there is a limit on the number of NamedMethods that can be instrumented. Once this limit has been reached, no more methods are instrumented to display in the Application Servers Monitor > Methods view. A warning is logged for each method that is configured to be instrumented but is not instrumented when exceeding the allowed number of NamedMethods.
If you have configured too many NamedMethods and you are getting this warning, the first course of action is to modify your NamedMethods MethodList to only include the methods you are interested in or to be more specific in your named method definitions. If you have done that and are still getting warnings, you may increase the limit by editing the MaxNumberOfMethodsTracked property in the agent instrumentation profile. The default value is 100.
For more information about editing agent instrumentation configurations, see the Foglight for Java EE Technologies Installation Guide.

