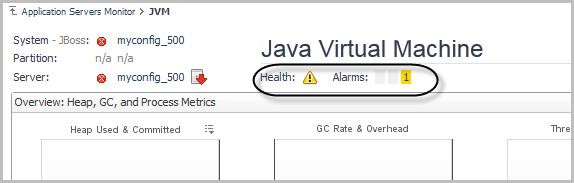
For more information about the rules that generate alarms for the JVM, review the rules on the Foglight Rule Management dashboard (Dashboards > Administration > Rules & Notifications > Rules > search for “JVM”).
For more information about individual views, see Application Servers Monitor Views .
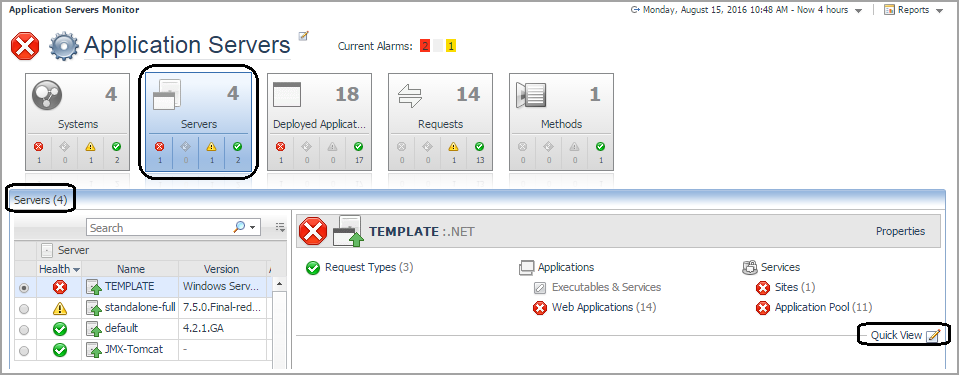
Use the Servers tile of the Application Servers Monitor dashboard to monitor specific application servers. From this view, you can investigate individual application servers in your internal and remote infrastructure and review the invoked operations that these application servers use.
To learn more about the supported application servers, see one of the following guides:
From this view, you can perform the following actions:
|
1 |
On the navigation panel, under Dashboards, click Application Servers > Monitor. The Application Servers Monitor dashboard opens. |
|
2 |
Click the Servers tile. |
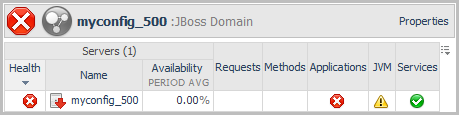
Each monitored component in the server details view has a health status icon, and each component name is a link. To view the health summary for the component, click the status icon. For more information, see Reviewing the health of your systems.
To view more details about a component, click the name link. A pop-up or drilldown view opens, providing more information. For example, click JVM to open the Java Virtual Machine (JVM) view.
The Quick View option provides condensed charts that show the general state of a selected system. These charts answer questions such as: What are the slowest three requests on server ABC, or what thread pools have the most waiters? The Quick View Selection menu differs for application server type. The following table outlines the charts available for each application server.
|
JDBC data sources with highest number of threads waiting for a collection. | |
|
JCA Pools with highest number of threads waiting on average. | |
|
1 |
On the navigation panel, under Dashboards, click Application Servers > Monitor. The Application Servers Monitor dashboard opens. |
|
2 |
Click the Servers tile. |
|
3 |
Click Quick View, or the edit icon beside the text. |
|
5 |
Click OK to close the dialog box. The Quick View refreshes. |
|
1 |
On the navigation panel, under Dashboards, click Application Servers > Monitor. The Application Servers Monitor dashboard opens. |
|
2 |
Click the Systems tile. |
|
1 |
On the navigation panel, under Dashboards, click Application Servers > Monitor. The Application Servers Monitor dashboard opens. |
|
2 |
Click the Servers tile. |
|
• |
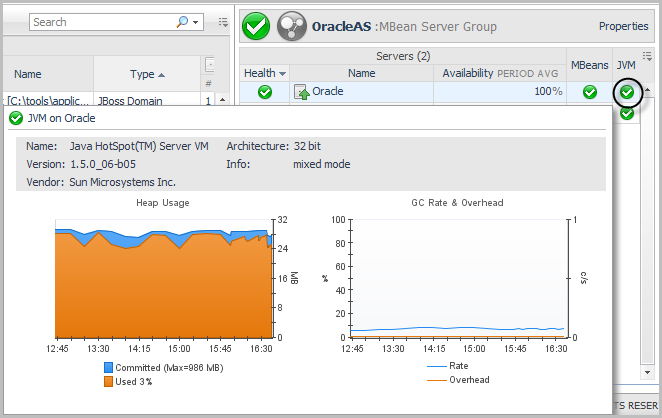
Hover your mouse over the JVM link in the server details area to open a dwell that displays the Heap Usage and GC Rate & Overhead charts. Click the Heap Usage chart in this dwell to open the JVM view. |
|
• |
Click JVM in the server details view. The JVM view opens. |
|
• |
Click Quick View, located just below the server details view, and select JVM — Heap Usage from the dialog box that opens. Click OK. The JVM Heap Usage chart appears in the Quick View area. |
The top portion of this view lists the System, Server, and Health information. Click any status icon to review the health of that component. For more information about the rules that determine the Java Virtual Machine (JVM) health status, review the rules on the Foglight Rule Management dashboard (Dashboards > Administration > Rules & Notifications > Rule Management > search for “JVM”).
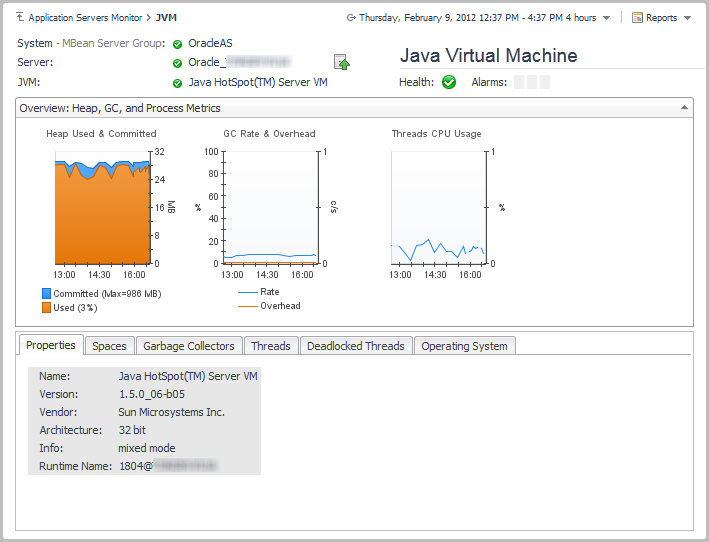
To see more details about the JVM, click one of the tabs in the JVM view below the charts. For more information, see JVM view.
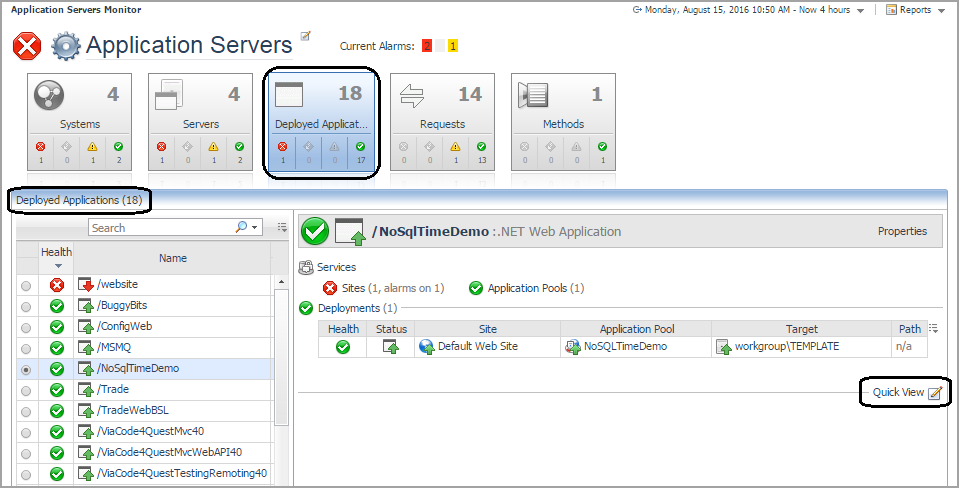
On the Application Servers Monitor dashboard, the Deployed Applications tile lists all the deployed applications running in a monitored environment (domain, cell, cluster topology, server group, or partition) and the related components, such as Application Pool, EJBs, Web Applications, and the Web Services health status. From here you can drill down to explore the components in further detail.
From this view, you can perform the following actions:
|
• |
Review source metric charts in Quick View |
|
• |
|
1 |
On the navigation panel, under Dashboards, click Application Servers > Monitor. The Application Servers Monitor dashboard opens. |
|
2 |
Click the Deployed Applications tile. |