Submitting forms on the support site are temporary unavailable for schedule maintenance. If you need immediate assistance please contact technical support. We apologize for the inconvenience.
MBean Health Breakdown. The current number of MBeans in each state (Normal , Warning , Critical , Fatal ), along with a color-coded bar. The length of colored bar indicates the number of MBeans in the corresponding state compared to the total number of MBeans.
•
Free Memory. The current free JVM memory, expressed as a percentage of the total allocated.
Health History Bar. The color-coded bar represents the alarm state of the monitored component over the time range selected in the SOC. The color of the bar changes depending on the alarm state. Red indicates a Fatal state, orange indicates Critical, yellow means Warning, and green is the Normal state.
•
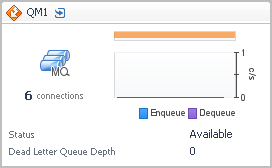
Enqueue/Dequeue. The plotted message enqueue and dequeue rates.
•
Status. The average queue status for the time range: available, unavailable, or unknown.
•
Dead Letter Queue Depth. The average depth of the dead letter (undeliverable messages) queue.
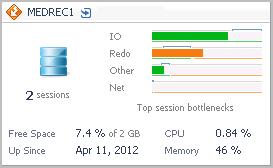
Sessions. The current average number of active sessions.
Top Session Bottlenecks. A breakdown of the health state of potential session bottleneck points by severity. The four top used resources from the list below are displayed on the tile.
You can find online support help for Quest *product* on an affiliate support site. Click continue to be directed to the correct support content and assistance for *product*.
Related Documents
The document was helpful.
Select Rating
I easily found the information I needed.
Select Rating
IE 8, 9, & 10 No longer supported
The Quest Software Portal no longer supports IE8, 9, & 10 and it is recommended to upgrade your browser to the latest version of Internet Explorer or Chrome.