|
1 |
|
4 |
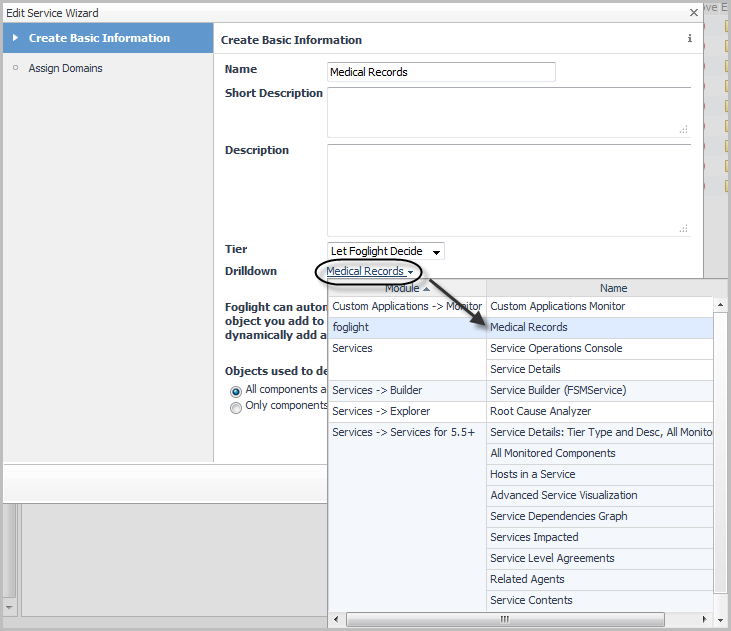
On the Create Basic Information page, click the text link beside Drilldown. A list opens. |
|
7 |
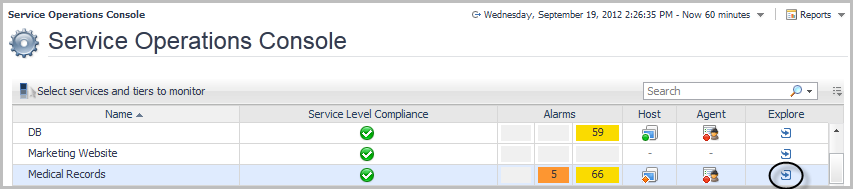
Click Finish. |
|
|
|
|
|
|
|
|
|
|
|
|
|
|
|
|
|
|
|
|
|
|
|
|
|
|
|
|
|
|
|
|
|
|
|
|
|
|
|
|
|
|
|
|
|
|
|
|
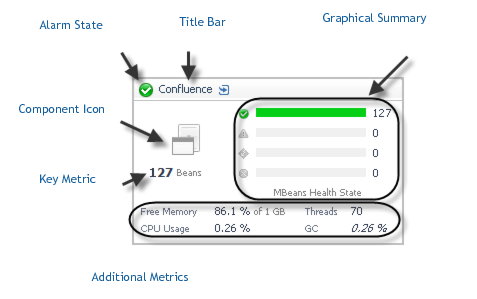
NOTE: The values of these metrics are always current, unless the value appears in italics (for example, GC 0.26%). Italicized metrics reflect the period average instead of the current value. |

| |||
| |||
| |||
| |||
|
