Evolve offers many different possibilities for how you want the information in your Index Pages and Object Pages to be displayed.
These display options are controlled by Layouts and Behaviors.
Layouts control the physical structure of the web page, whereas Behaviors control how the data is displayed inside the Layout. Some Behaviors can only work with certain Layouts. Additionally, some Layouts and Behaviors can only be used on Index Pages, while others can only be used on Object Pages. However, some can be used on both.
Use the table below to see all the page display options available in Evolve, then follow the links to find out how to create them in your own Site.
|
|
There are a number of different options for how you want to display the properties of objects on Object Pages. For full details on these display options see: |
|---|
Page Display Options
|
Type |
Example |
Description |
Editable? |
Used in |
|---|---|---|---|---|
|
|
The Simple List is the default Layout for all new Index Pages and displays objects in a simple bulleted list. On Object Pages this layout is used to show related objects, such as Associations or Diagrams the object appears on. |
No |
Index Pages Object Pages | |
|
|
An Accordion is an Object List where each object reference is clickable and can be expanded to show further information about the object -either properties of the object, or associations. When you use an Accordion, you can nest other Layouts and Behaviors inside it, such as another list of Associated Objects. |
No |
Index Pages | |
|
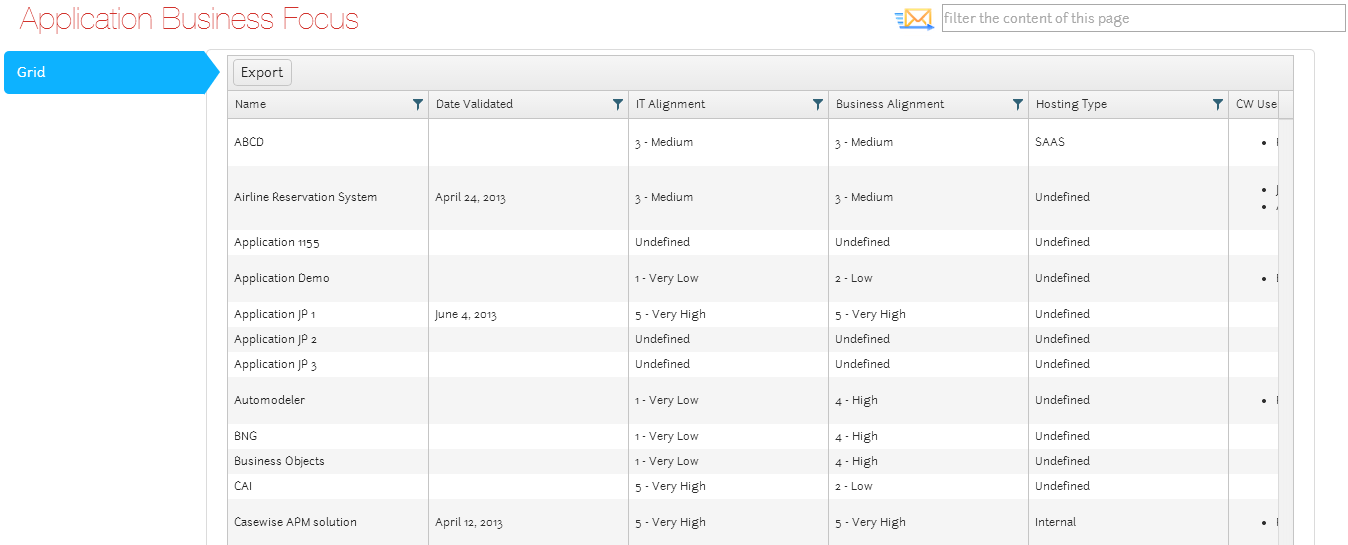
A Table (Complex) behavior displays objects and properties in table format. You can choose which properties to display as columns, and you can include associations. Users can sort the list by clicking column headings, and they can optionally edit objects directly in the Table itself. |
Yes |
Index Pages Object Pages | ||
|
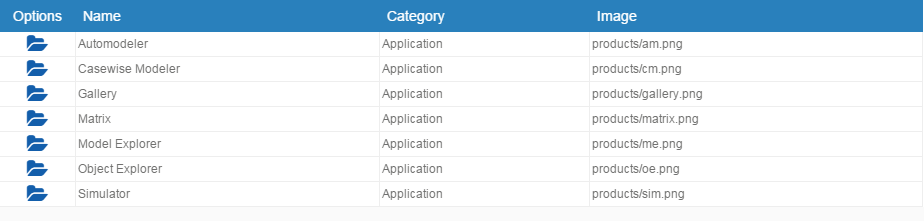
The Table (Simple) layout creates a basic table for displaying lists of data, with the ability to open the Object Page for a listed item. |
No |
Index Pages Object Pages | ||
|
|
A Simple Matrix creates a table which displays Associated Objects for the object in question, and shows which other similar objects these Associated Objects are associated to. For example, you could show which Risk objects your Process is associated with, and which other Processes are associated with those Risks. |
No |
Object Pages | |
|
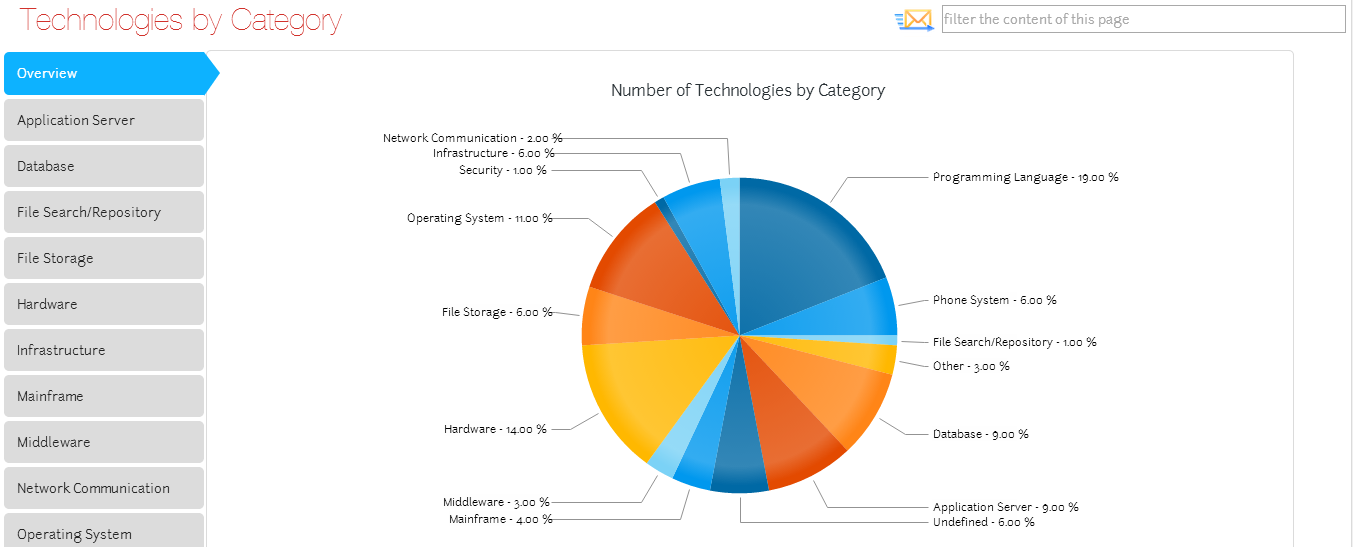
This list-type display organizes your objects into groups based on the value of Lookup properties (drop-downs such as Category). Vertical tabs on the left side of the page are used to represent the values, while the objects themselves in each tab are displayed in simple lists. Option You can optionally include an Overview Chart which creates an 'Overview' tab displaying a Pie Chart showing the proportion of each value. |
No |
Index Pages | ||
|
|
The Pie Chart based on Lookup Values display creates a chart for a specified Object Type showing the percentage of objects with values from one Lookup (drop-down) property. The chart is identical to the optional Overview Chart offered by the Tabs based on Lookup Values display. |
No |
Index Pages | |
|
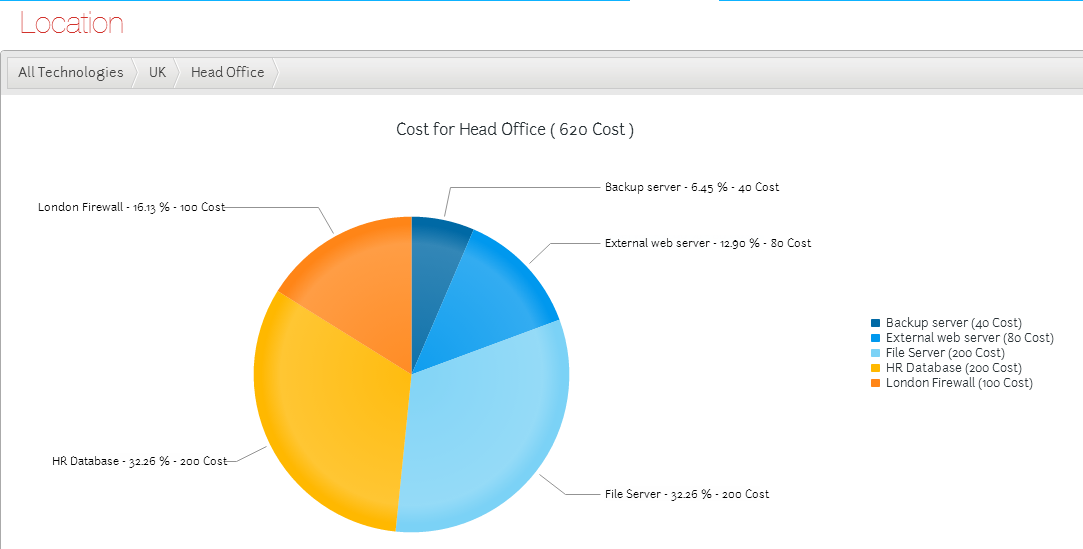
A Recursive Pie Chart allows you to show a top-level chart which sums the values of properties of associated objects (or Intersection Objects), and then allows users to click those items to view a second chart showing all the objects associated to the selected object. |
No |
Index Pages Object Pages | ||
|
|
A Roadmap is a type of Gantt Chart that enables you to show a number of objects and their start and end dates. |
No |
Index Pages Object Pages | |
|
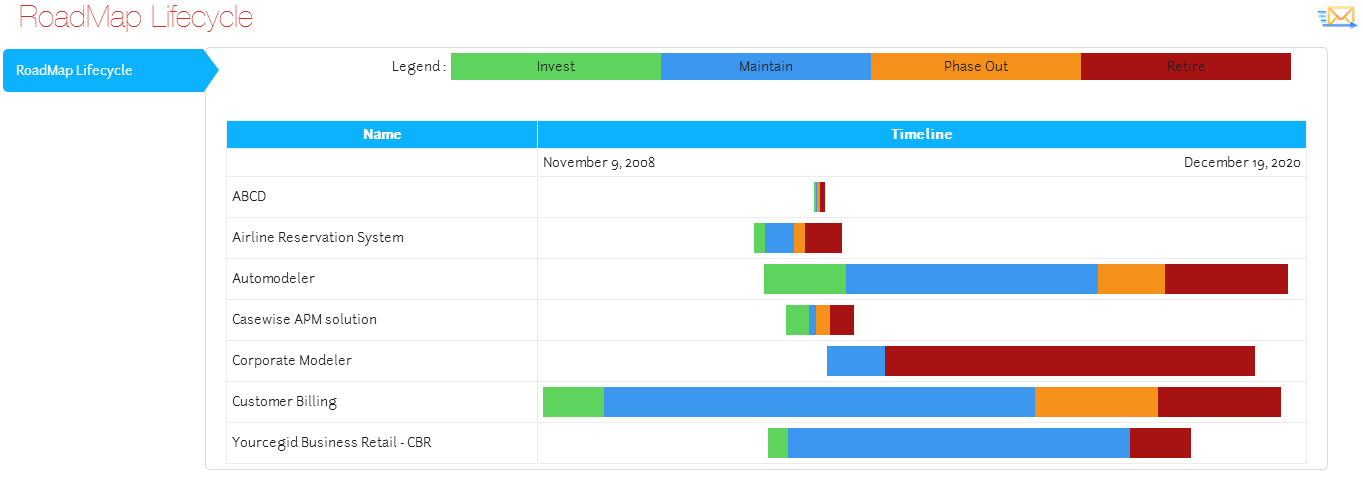
A Lifecycle Roadmap is a type of Gantt Chart that enables you to show a number of objects, displaying their overall time frame, as well as highlighting in different colors any number of phases of their lifecycle. |
No |
Index Pages | ||
|
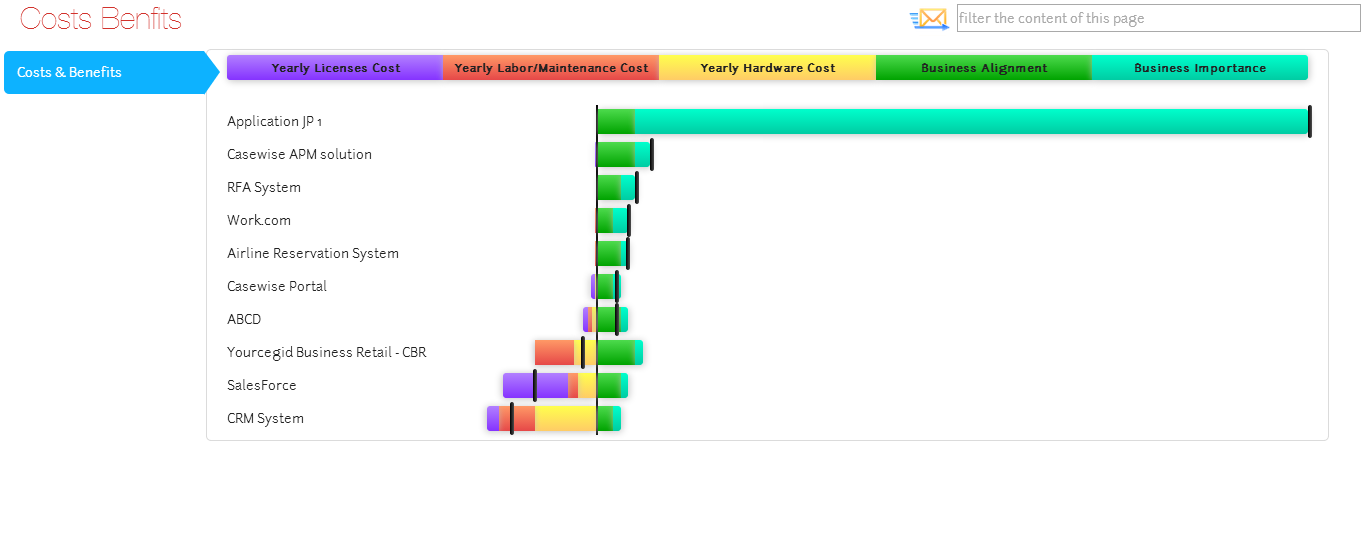
A Cost/Benefit Chart enables you to compare properties you class as Costs in your organization against properties you class as Benefits. The result is a chart that allows you to evaluate your expenditure in terms of business importance. |
No |
Index Pages | ||
|
|
The Simple Bar Chart behavior displays a simple bar chart on your Index Page, listing a maximum of 20 objects on the y axis and referencing a simple number property on the x axis. |
No |
Index Pages | |
|
|
On your Index Page, the Multi-Axis Bar Chart behavior displays a simple bar chart which compares the values of two properties of the objects referenced. |
No |
Index Pages | |
|
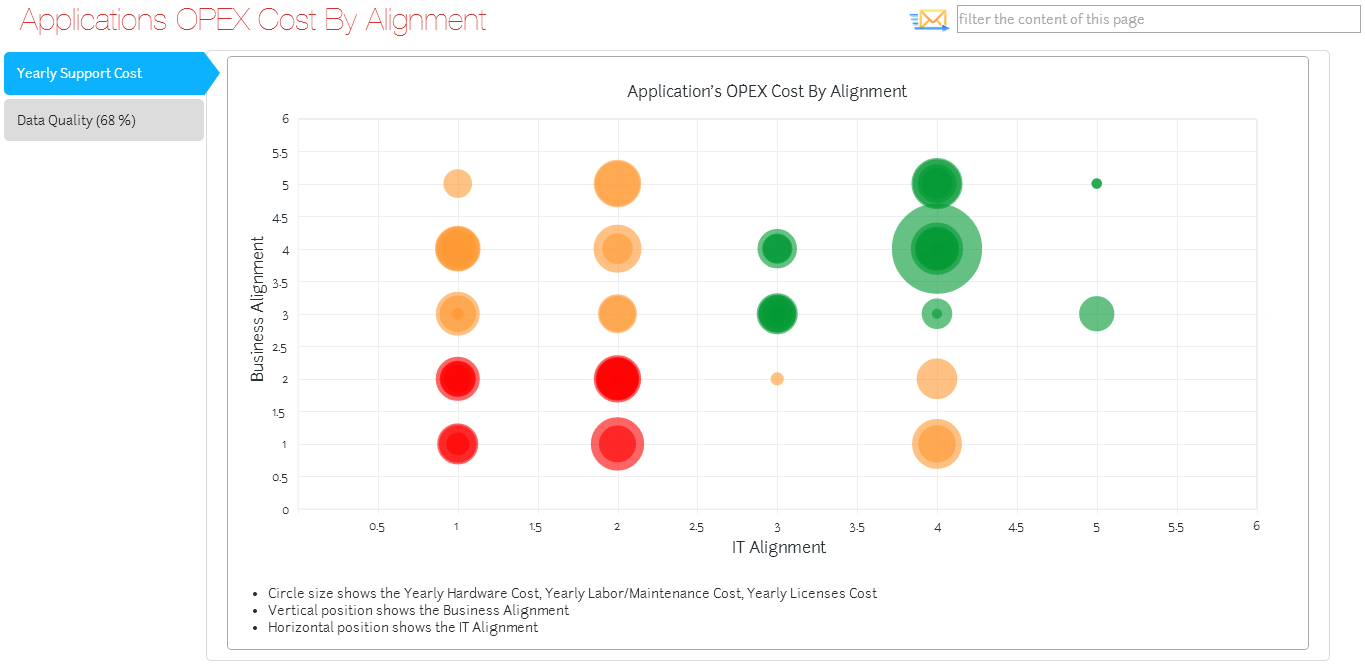
Simple Bubble Charts allow you to compare objects of the same type, by analyzing three levels of data and using the values to affect the size and position of the representations on the chart. |
No |
Index Pages | ||
|
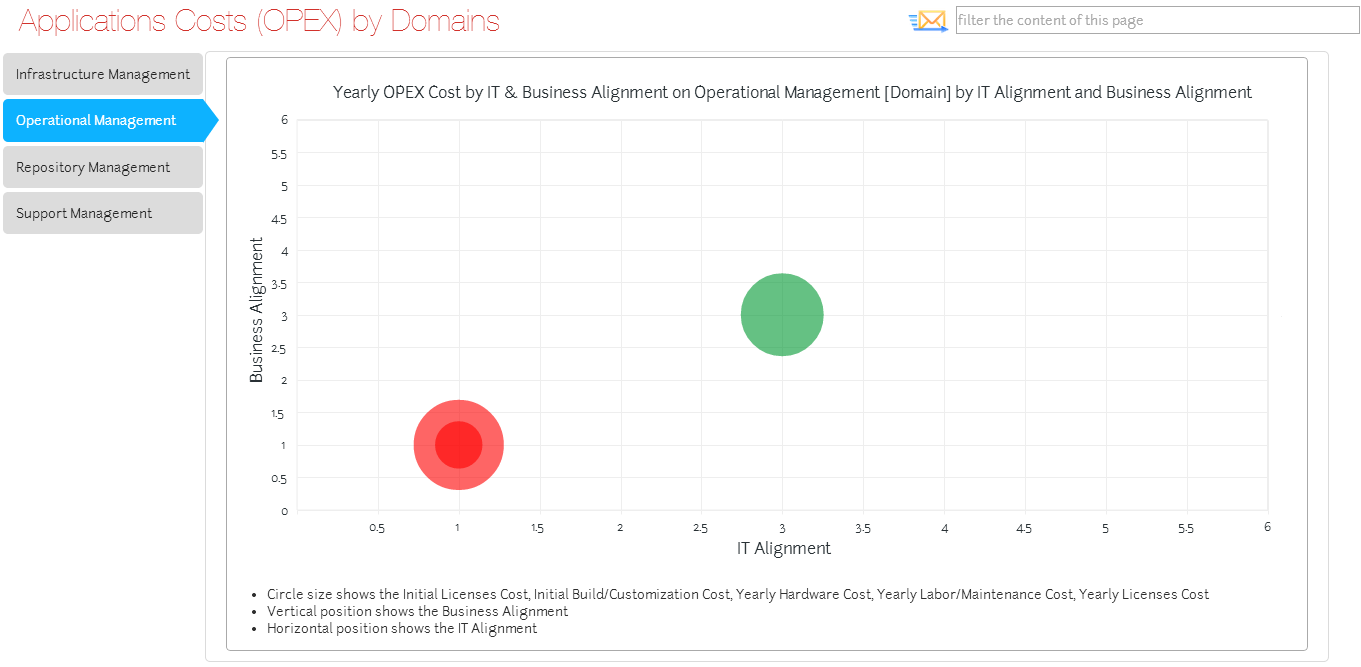
Cluster Bubble Charts are similar to Simple Bubble Charts, except they allow you to visualize the properties of an Associated Object (directly or indirectly), or an Intersection Object. |
No |
Index Pages | ||
|
|
The Visual Identity layout is used to show a list of objects with visual indicators to represent some of their properties. The layout displays each object as a rectangle, and then at the bottom of each shape you can show icons to represent the values of one or more properties of your object. The Visual Identity layout requires a Custom Site deployment. |
No |
Index Pages Object Pages | |
|
The External Picture layout can be used to display an image, stored on the Evolve server, which is referenced as a property of an object. The External Picture layout requires a Custom Site deployment. |
No |
Index Pages Object Pages | ||
|
|
The Image Layout is used to display an image for an object that is referenced using a Single-Line Text or URL Property. It is used on its own, not together with other properties, so suits larger images more. |
No |
Index Pages Object Pages | |
|
|
Vector Maps enable you to highlight countries or places on a map so that the user can click through to see more detailed information about that area. |
No |
Index Pages Object Pages | |
|
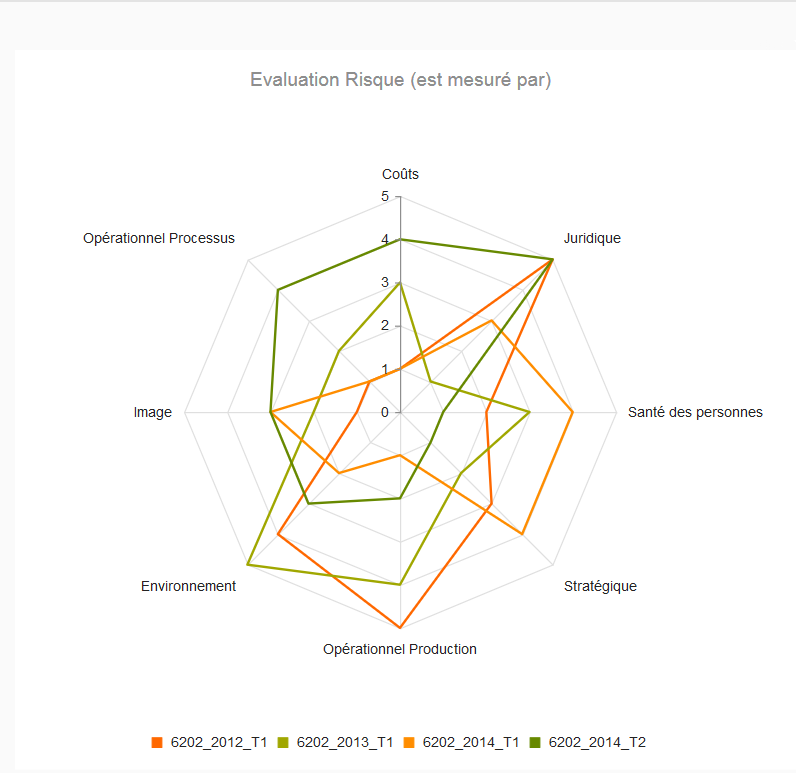
The Radar Layout is used to display and compare three or more properties of an Object, or many Objects, in one chart. It is used on its own, not together with other properties, so suits larger images more. |
No |
Index Pages Object Pages | ||
|
|
Layout reserved for internal Evolve use. |
No |
Index Pages Object Pages |

