Regions view
The Regions tree view lists the regions existing in your AWS environment and shows their state. This view appears on the left when you select the Regions tile in the Actions bar.
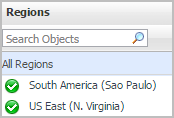
Selecting the All Regions node displays the Summary - All Regions view on the right. Similarly, selecting a region node shows region-specific metrics in the Region Summary view on the right.
Explore - All Regions view
The Explore - All Regions view appears when you click Explore in the Summary - All Regions view.
This view consists of the following embedded views:
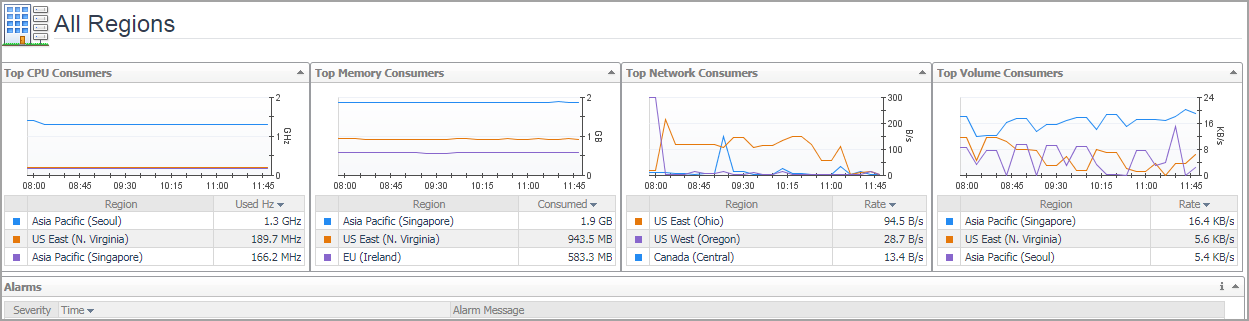
Summary - All Regions view
The Summary - All Regions view appears on the right when you select All Regions in the Regions view.
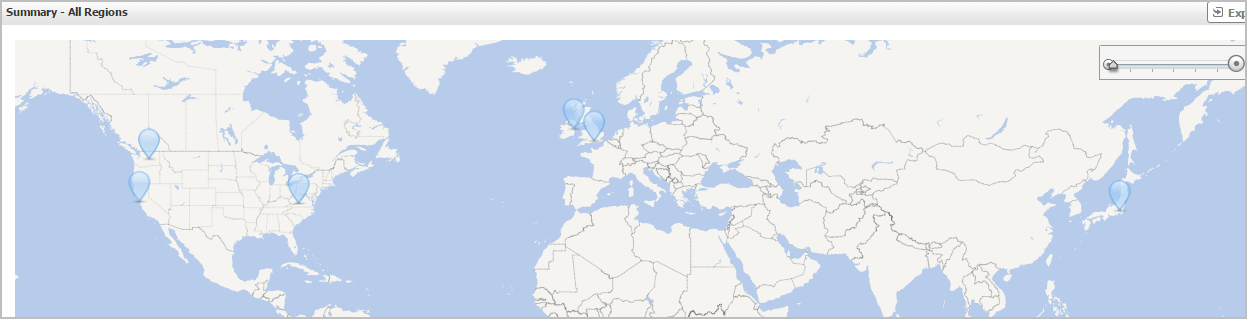
Hover over any bubble in this graph to display a dwell, showing Accounts, EC2 Instances, and EBSs.
Click any bubble in this graph to open the Region Summary view, showing Related Items, Resource Utilization, and Alarms.
Region Summary view
The Region Summary view appears on the right when you select a region in the Regions view.

This view consists of the following embedded views:
|
|
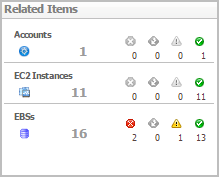
Shows the numbers and states of the selected regions. |
|
|
|
• |
EC2 Instances. The number of the ECS2 instances that are associated with the selected region, followed by related alarm counts, broken down by the alarm state (Normal, Warning, Critical, Fatal). | |
|
|
|
• |
EBSs. The number of the EBSs that are associated with the selected region, followed by related alarm counts, broken down by the alarm state (Normal, Warning, Critical, Fatal). | |
|
|
|
• |
Accounts. The number of the accounts that are that are associated with the selected region, followed by related alarm counts, broken down by the alarm state (Normal, Warning, Critical, Fatal). | |
|
|
Drill down on: |
|
|
|
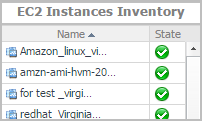
• |
EC2 Instances. Displays the EC2 Instances Inventory dwell, showing the name and state of the associated Resource Groups. |
|
|
|
|
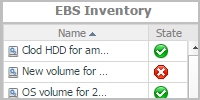
• |
EBSs. Displays the EBS Inventory dwell, showing the name and state of the associated virtual machine. |
|
|
|
|
• |
Accounts. Displays the Other Items Inventory dwell, showing the name and state of the associated accounts. |
|