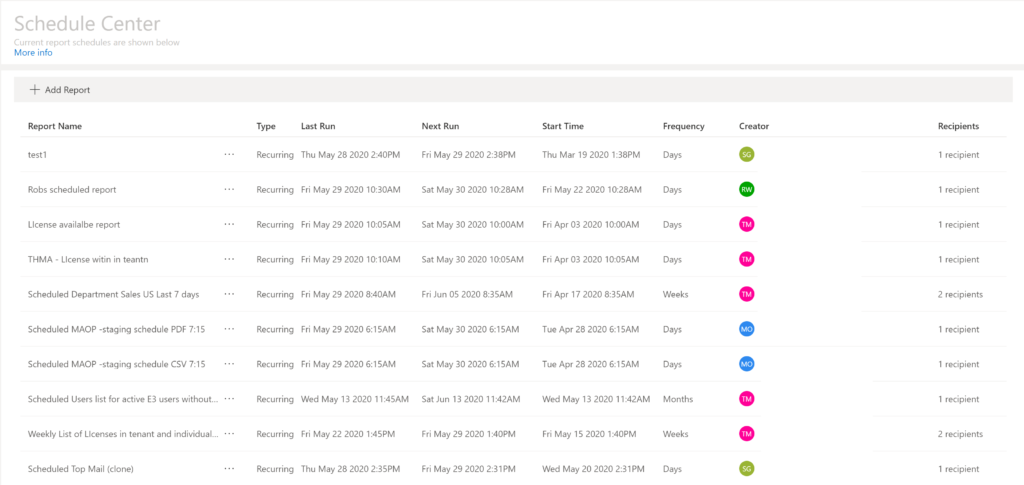
Use the Schedule Center to see and manage the scheduled reports you currently have set up. Schedules you set up in Nova Reporting are automatically added to the Schedule Center.
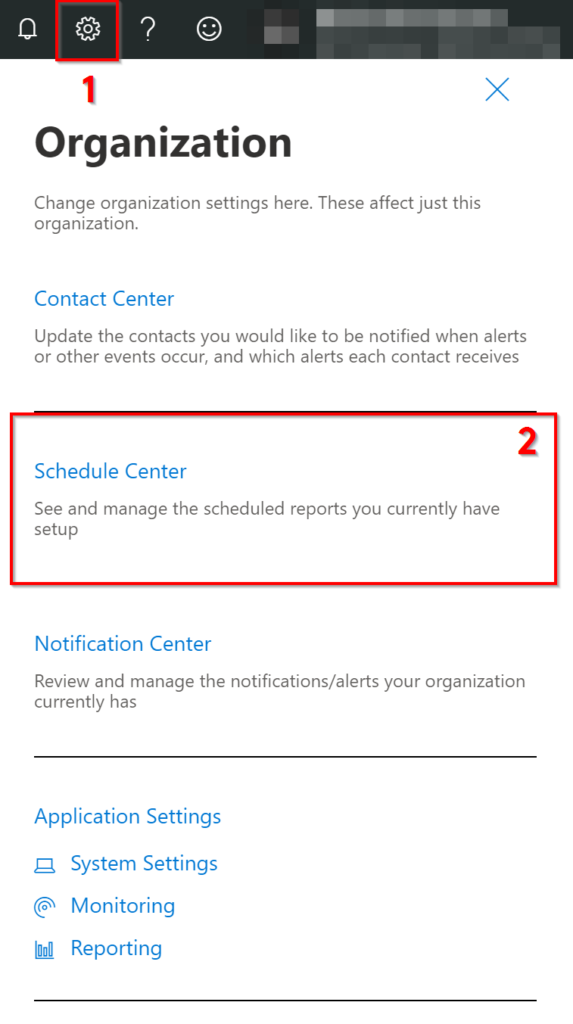
To access the Schedule Center, click the Settings button (a gear) located in the top right of the Nova window, and then select Schedule Center, as shown below.
It shows a list of previously scheduled reports, as shown below.
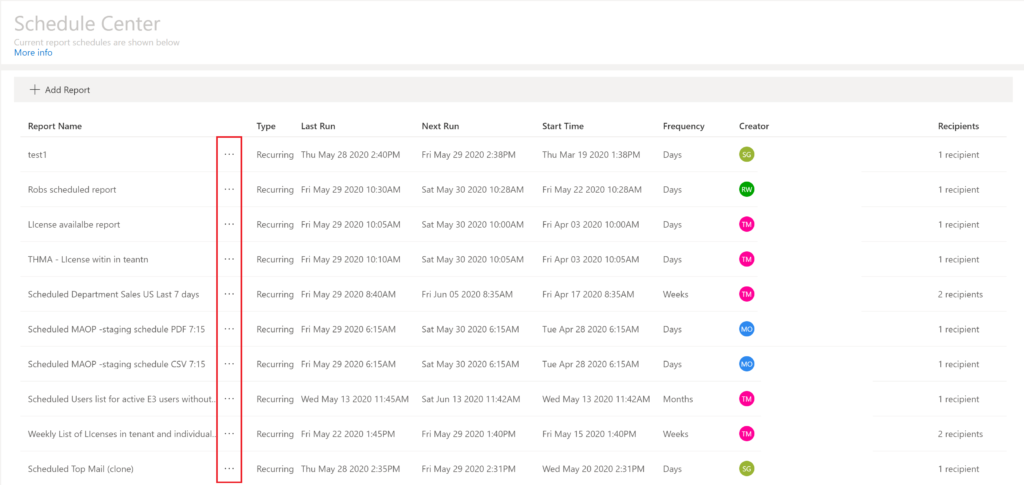
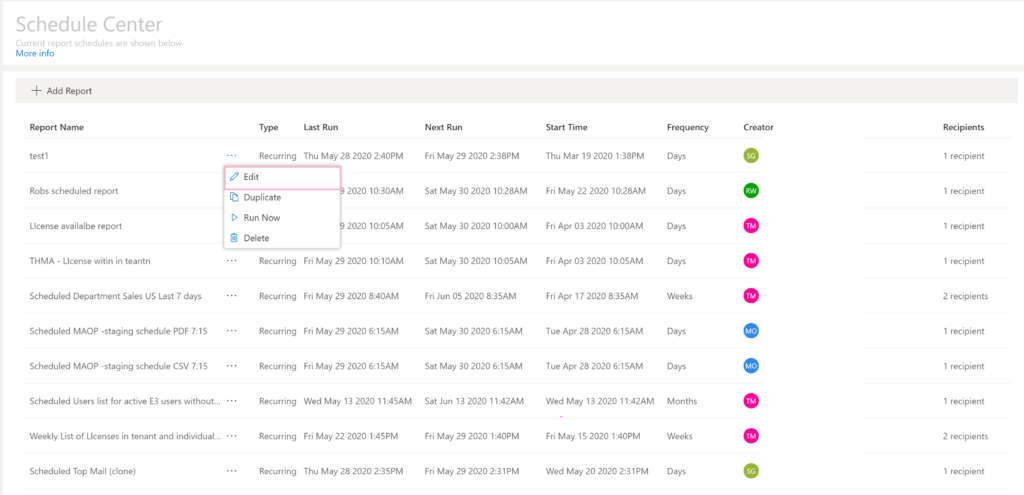
You will notice an ellipsis next to each scheduled report. Use the Edit button to change a report schedule, as shown here:
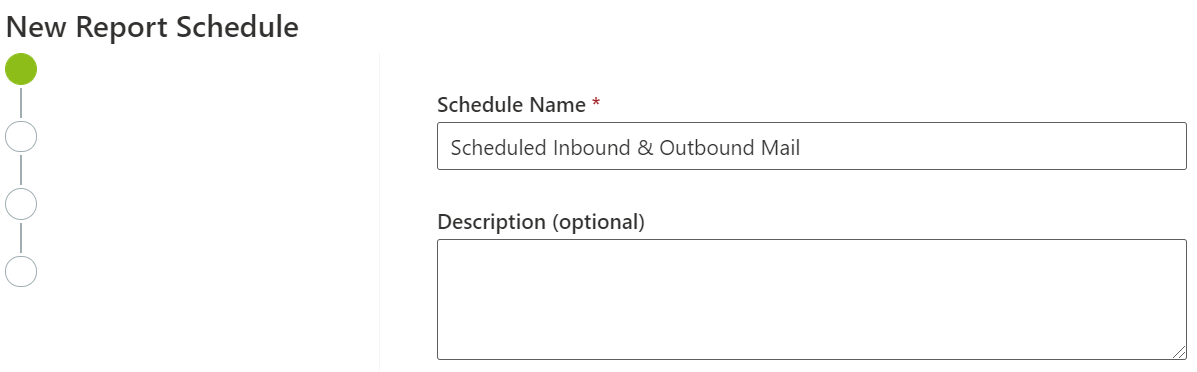
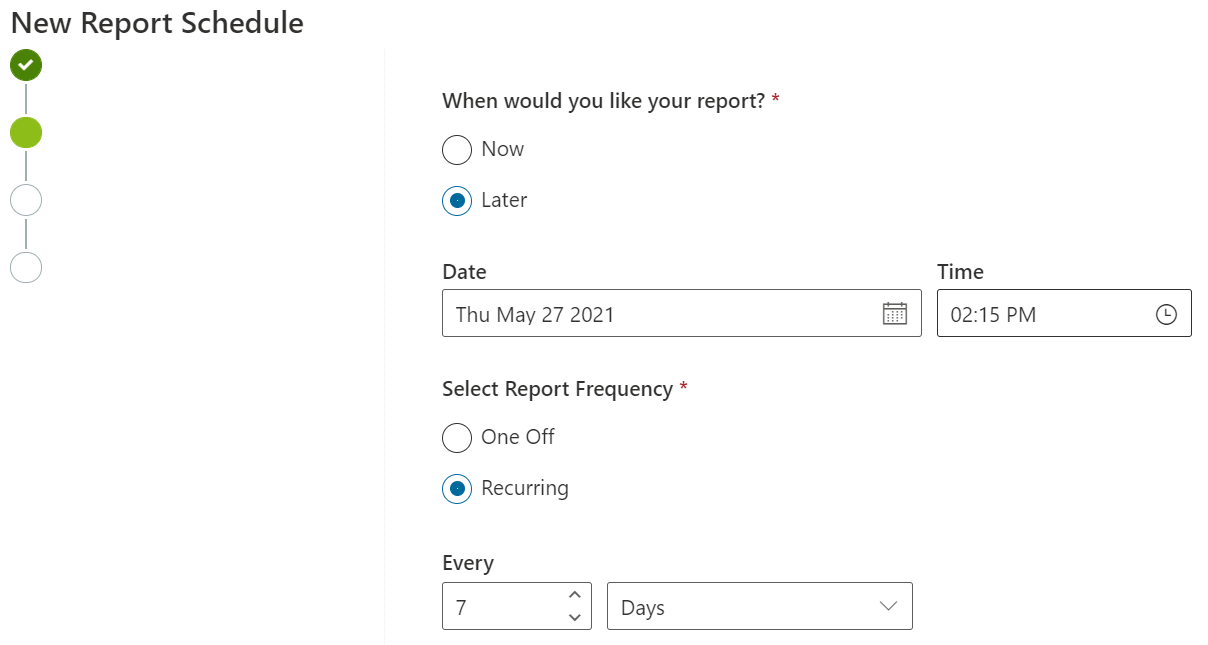
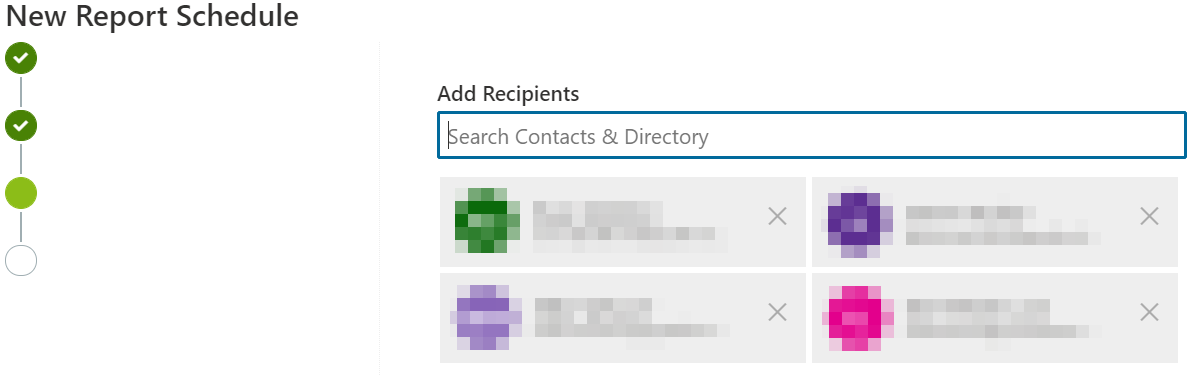
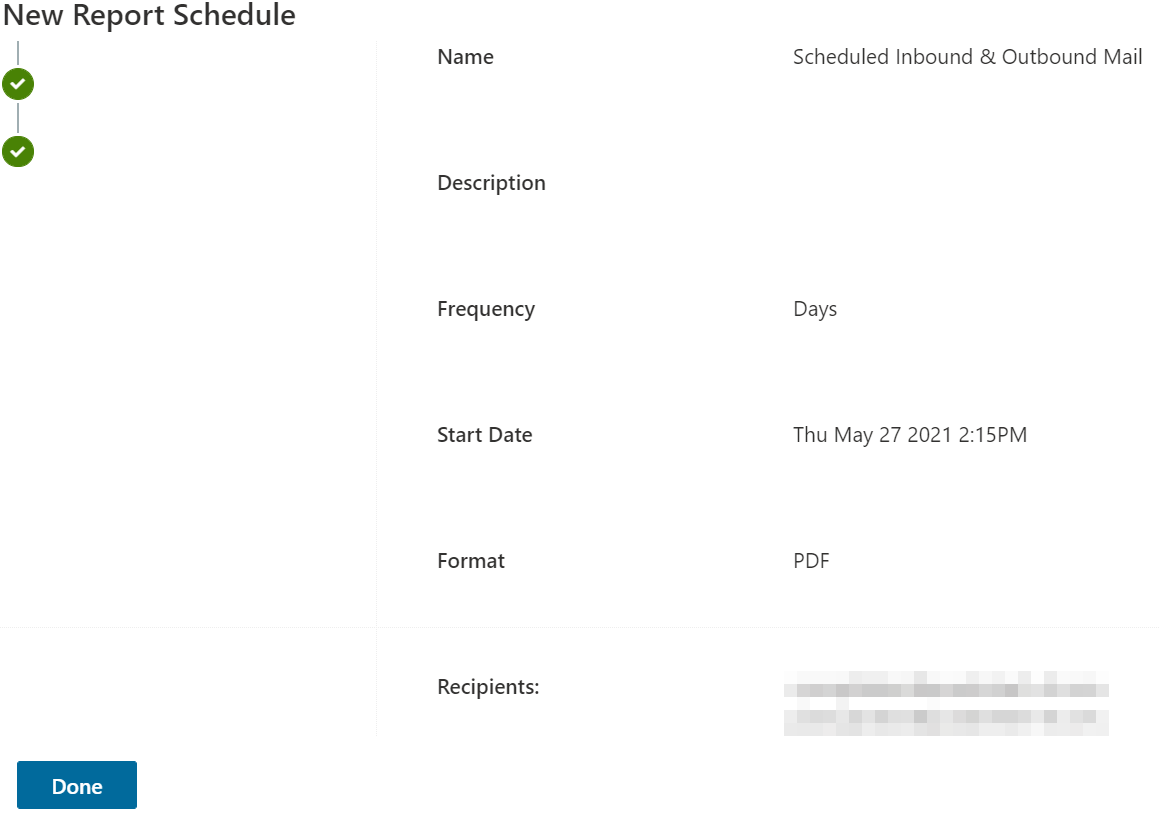
This will bring you to the schedule screen, as seen in the images below.
Naming and describing the report
Scheduling the report (time, date and frequency)
Adding recipients for the report
Selecting the format for the report and how you would like your report to be received
Finalizing your scheduled report
For example, you could schedule a subscription overview report to be sent to the CTO at the beginning of each month, so they can see how many Microsoft 365 licenses are being used and are available across the organization.
A video regarding the Schedule Center can be seen here.
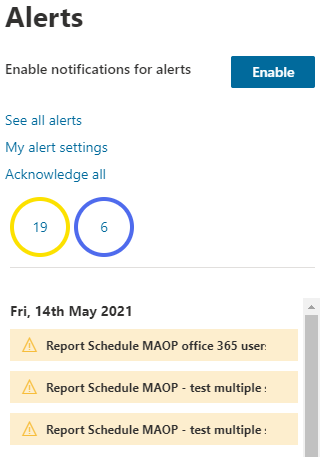
The notification center is where you will see Nova-based alerts and notifications across your organization. Find an overview of your notifications by clicking the bell icon in the banner.
To be notified when a new alert is registered, click Enable, then Allow based on your browsers settings.
From here, you will see an overview of alerts, sorted by date and its critical status.
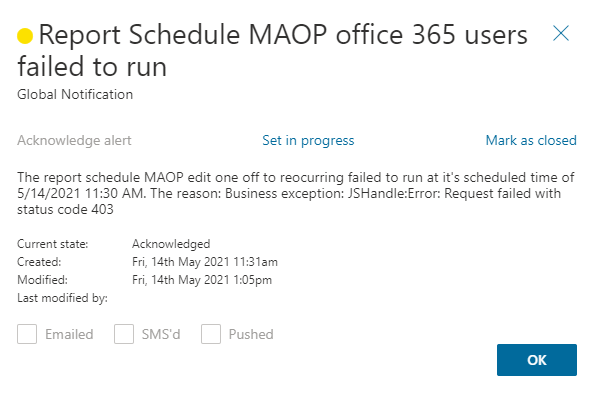
Going into detail on a notification
To see an alert in more depth, click on the notification bell, then click on an alert. You will see a screen similar to the one below.
From here, you will see:
·What the alert is about
·When the alert happened
·The reason for the alert
·The alert's current state
·When the alert was created
·When the alert was last modified
·Who modified the alert
·If the email was emailed out, sent by SMS or pushed within the application, depending on how you configured the settings.
Dashboard
By clicking on the bell icon, and then click See all alerts, it will take you to the Notification Center dashboard.
Here, you can see all alerts that have been registered since the beginning of your subscription. From the dashboard, you can:
·Sort by Severity, Alert Name, Alert Source, Alert State and Date Added.
oChoose the columns you would like in the dashboard by clicking the plus (+) icon in the top right corner, and select/deselect as appropriate.
·Mark each alert as in an Acknowledge, In Progress or Closed state by either:
oClicking on the ellipses and selecting the appropriate alert state.
oClicking on the check box to the left of the alert, clicking Manage, then selecting the appropriate alert state.
·Click on the ellipses and select Details to view the details of the alert, similar to above. You can also select your alert state from here.
Alert severity
Alert severity gives you information on the status of an alert, and if attention or action is needed:
·Informational: These alerts describe events that have occurred within your tenant that you do not need to take action on. An example of an informational alert is notifying you that a scheduled report has been successfully sent.
·Healthy: A healthy notification alerts you that a critical error has successfully been resolved.
·Degraded: A degraded alert arises when an error occurs that needs attention. An example is when a scheduled report is unsuccessfully sent. Viewing the details shows you specifically what the error is and why it failed.
·Critical: A critical alert is a notification that needs immediate attention.
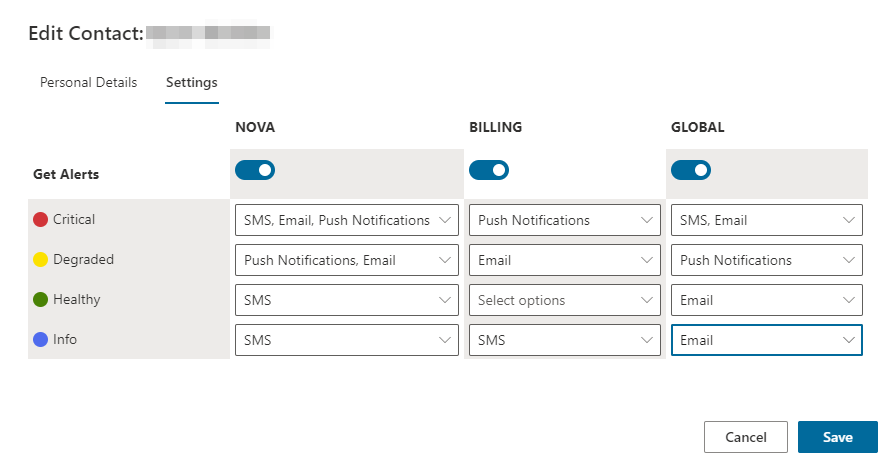
Alert settings
Alert settings are where you can set up notifications to be sent via email, SMS or pushed to you within Nova. You can find alert settings by clicking on the bell icon, then My alert settings.
If you would like to be sent notifications via email and/or SMS, enter your details within the Personal Details tab.
In the Settings tab, you can set up alerts for a range of categories (Nova, Billing and Global), and customize notifications depending on what you need to be notified about. For example, you can set up SMS notifications for Degraded alerts and receive push notifications and emails for Critical alerts. View the image below for an example of how you can set up notifcations.
Alert source
Alert sources are where your alerts are coming from. These sources are DPC, Radar, Reporting, Workflow, Accounting or Other.
Alert states
Alerts have four stages that can be changed by a user. Those are:
·New: The notification has entered the system and has not been looked into by any user.
·Acknowledged: The notification has been opened by a user.
·In progress: A user is investigating the notification.
·Closed: The notification has been investigated.
To change an alert level, click on a notification as described above, and click on either Acknowledge alert, Set in progress or Mark as closed.
The Custom Alert Center notifies users when there is a change to their organization. Users can build alerts based on a custom set of conditions and filters through a wide range of data sources.
On the Custom Alert Center screen, you will see:
·Alert Name - the name of the alert
·Active Status - if the alert has been enabled or disabled
·Date Added - the date in which the alert was created
·Last Trigger - when the alert was last triggered based on the conditions
·Creator - the name of the user who created the alert
To build a custom alert:
1.From the Nova dashboard, click the cog icon, and select Custom Alert Center.
2.Click Add Custom Alert.
3.Click Add Alert Name, and enter the alert name. Click Save a name when completed.
4.Enter the user email in which the alert should be sent to.
5.Optionally, to add more user emails, click the plus icon and enter the user email.
6.Select the data source in which you would like to be notified about.
7.Click Add alert condition, and select the field, operator and value of the data source. This defines the condition of the alert. You can also add multiple conditions by following the same step.
8.Click Save. The chosen user(s) will now be alerted based on the defined conditions.
By clicking on the ellipses next to the alert, you can take the following actions:
·Edit - change the alert
·Disable - disable the alert
·Delete - delete the alert
Use Case: Low E3 Licenses
As an example, you may want to be alerted when the number of E3 licenses in a tenant are lower than a threshold you desire. To be notified about this:
1.From the Nova dashboard, click the cog icon, and select Custom Alert Center.
2.Click Add Custom Alert.
3.Click Add Alert Name, and enter the alert name. Click Save a name when completed.
4.Enter the user email in which the alert should be sent to.
5.Optionally, to add more user emails, click the plus icon and enter the user email.
6.Select the Tenant Licenses data source, under the Tenant Licenses category.
7.Click Add alert condition, and select License Name.
8.Select the operator as contains.
9.In the text field, enter E3.
10.Click Add alert condition, and ensure the clause is And.
11.Select Unassigned Units.
12.Select the operator as less than.
13.Enter the desired number of licenses.
14.Click Save. The chosen user(s) will now be alerted based on the defined conditions.
Below are some how to's on Reporting.