The Nova Report Center is your home for reports.
It is important to differentiate what is meant between a section of a report and the report itself.
·A Section of a report are the individual charts, graphs and tables themselves. You can have one or multiple sections in a report.
·A Report is where individual data sections can be created, modified and stored.
You can interact with reports and sections in their own unique ways. Click here to find out more.
More on the Report Center can be found in the Quest Nova User Guide.
There are different types of reports that are immediately available to you in the Report Center, each with their own different actions.
System reports
System reports are pre-built reports that are available with your subscription straight away. With a variety of system reports at your fingertips, information on Microsoft workloads, user details, licensing, security and more are all ready for you to view. If you are brand new to Nova reporting, we have highlighted some system reports that you may find helpful.
|
Report Name |
Report Description |
Data Chart Type |
Report Section |
Section Description |
|---|---|---|---|---|
|
OneDrive Usage Charts |
An overview of users engagement with OneDrive. |
Combined Line Graph |
OneDrive Usage Summary |
Files edited and viewed, files shared internally and externally and files synced. |
|
Line Graph |
Files Viewed per Day |
Amount of OneDrive files viewed within a 30 day period | ||
|
Line Graph |
Files Shared Internally per Day |
Amount of OneDrive files shared within your organization over the past 30 days. | ||
|
Line Graph |
Files Shared Externally per Day |
Amount of OneDrive files shared outside of your organization per day over the past 30 days. | ||
|
Line Graph |
Files Synced per Day |
Amount of OneDrive files synced to OneDrive within the past 30 days. | ||
|
User Details |
An overview of the details of users within your environment. |
Table |
User Details |
Core user details, including display name, email, job title and department. |
|
Pie Chart |
Users by Country |
Amount of users in each country of your organization. | ||
|
Timeline |
Most Recent Password Changes |
Most recent password changes within your organization. | ||
|
Table |
List of Disabled Users |
List of disabled users but still are users within your organization. Fields include name, email, job title and department. | ||
|
License Overview |
An overview of your licenses at tenant level. |
Pie Chart |
Tenant License Distribution |
Licenses distributed within your organization, by license name. |
|
Table |
Licenses Purchases or Available |
Licenses that have been purchased and/or are available within your tenant. Data fields include licenses assigned, licenses unassigned, percentage of licenses that have been assigned and percentage of licenses that are idle. | ||
|
Table |
Licenses Applied by User |
Main license applied to each user. | ||
|
Table |
License Assignment Dates |
Licenses applied to a user, and when that license was used most recently. | ||
|
Pie Chart |
Has Exchange License |
How many users have and do not have an Exchange licensed assigned to them. | ||
|
Pie Chart |
Has Teams License |
How many users have and do not have an Teams licensed assigned to them. | ||
|
Pie Chart |
Has SharePoint License |
How many users have and do not have an SharePoint licensed assigned to them. | ||
|
Pie Chart |
Has Skype License |
How many users have and do not have an Skype licensed assigned to them. | ||
|
Pie Chart |
Has OneDrive License |
How many users have and do not have an OneDrive licensed assigned to them. | ||
|
Pie Chart |
Has Yammer License |
How many users have and do not have an Yammer licensed assigned to them. | ||
|
Mail Traffic |
An overview of mailing activity at tenant level. |
Line Graph |
Inbound Good Mail (Last 30 Days) |
Number of safe mail received in the environment within the past 30 days. |
|
Line Graph |
Outbound Good Mail (Last 30 Days) |
Number of safe mail sent from the environment within the past 30 days. | ||
|
Line Graph |
Inbound Spam (Last 30 Days) |
Number of spam mail received in the environment in the past 30 days. | ||
|
Line Graph |
Outbound Malware (Last 30 Days) |
Number of spam mail being sent from the environment in the past 30 days. | ||
|
Table |
Mail Traffic Statistics (30 Days) |
An overview of mail traffic within the environment within the past 30 days. Data fields include Inbound and Outbound Good and Spam mail, as well as Outbound Spam Envelope and IP Block. | ||
|
Table |
Spam and Malware Traffic (30 days) |
Number of spam and malware mail being sent and received within the environment within the past 30 days. | ||
|
Heat Map |
Messages sent this month |
Amount of messages sent by department in the past 30 days. | ||
|
Teams Usage |
An overview of Microsoft Teams usage by users at tenant level. |
Stacked Line Graph |
30 day call, chat and meeting count |
Amount of calls, chats and meetings held within Teams in a 30 day period across the environment. |
|
Column |
Teams Chats by Department (This Month) |
Amount of Teams chat messages being sent across the environment by department in the past 30 days. | ||
|
Column |
Teams Meetings History by Department (This Month) |
Amount of Teams meetings being held across the environment by department in the past 30 days. This chart is sorted by department. | ||
|
Stacked Column |
Teams Meetings History by Department (This Month) |
Amount of Teams meetings being held across the environment by department in the past 30 days. This chart is sorted by date. | ||
|
Stacked Column |
Teams Chats by Department (This Month) |
Amount of Teams chats being sent across the environment by department in the past 30 days. This chart is sorted by date. | ||
|
Irregular Sign-Ins |
Details on unknown sign-ins at tenant level. |
Table |
List of Irregular Sign-Ins |
Details on failed sign-ins, including Failure Reason, Sign-In Date and Time and Error Code. |
|
Pie Chart |
Location of Irregular Sign-Ins (Last 7 Days) |
Irregular sign-ins by country in the past 7 days. Interactive wedges include information on Failure Reasons and Sign In Time and Date. | ||
|
Table |
Irregular Sign-In Details Count (Last 7 Days) |
Details on the amount of errors that each Error Failure has had in the past 7 days. | ||
|
Mobile Device Type and Distribution |
Details on users' mobile device types and operating systems at tenant level. |
Pie Chart |
Devices by Client Type |
Amount of users associated with each client type. |
|
Stacked Column |
Devices by OS with Department |
Amount of users associated with each mobile Operating System, sub-grouped by department. | ||
|
Pie Chart |
Active Device OS Distribution |
Amount of users associated with each mobile Operating System. | ||
|
Table |
Apple Devices |
A list of users who have an Apple device. Data fields include assigned country, access state and device model. | ||
|
Table |
Android Devices |
A list of users who have an Android device. Data fields include assigned country, access state and device model. | ||
|
Table |
Windows Devices |
A list of users who have a Windows device. Data fields include assigned country, access state and device model. | ||
|
Heatmap |
Device by Type and Country |
A chart of how many device manufacturers are associated with users by country. | ||
|
Administrative Roles and Global Administrators |
Details on users' roles and role distribution within an environment. |
Table |
Administrative roles |
A list of users' who have been granted administrative roles within an organization. |
|
Table |
Global Administrators |
A list of users' who have been granted a global administrator role within an organization. | ||
|
Table |
Defined Roles |
A list of users' who have a specific role assigned to them. | ||
|
Pie Chart |
Role Distribution |
The number of users in specific roles. | ||
|
Table |
Users with Administrative Role (Extended Details) |
Details on a user's role, including role name, type and description. | ||
|
Timeline |
Changes in Roles |
Names and details of users' that have had their roles changed. |
System reports can be downloaded as a CSV format, but can not be edited, scheduled or deleted from the Report Center. If you would like to edit or schedule a report, you can do so by cloning it, which you can do by clicking on the ellipses or by opening the report and clicking on 'Edit', which will prompt you to clone the report. To find out more on what you can do with a report, click here.
Public reports
Public reports can be seen, edited, printed, scheduled and/or downloaded by your organization.
Private reports
Private reports can only be seen by you, and are hidden from the other users of your organization. You can take the same actions as public reports.
There are a variety of actions you can take with your reports to suit your needs.
|
|
NOTE: The following actions can be taken on Public and Private reports. System reports can not be edited or scheduled without being cloned. |
From the Report Center
There are multiple actions you can take from within the Report Center. The following are actions by clicking on the ellipses on each report:
·Clone: This is a duplication of the Report. This is helpful if you need to make small but important tweaks to a report.
·Download JSON: You can download a report into a JSON file, which can then be imported into the Report Center. This is helpful if you need to send a private report to another user within the organization.
·Schedule: You can schedule a report to be sent out to one or multiple users, within a time frame that you create yourself, in either a CSV or PDF format. To find out more about scheduling a report, check out the Quest Nova User Guide.
·Delete: You can remove a report from the Report Center.
You can also:
·Import report JSON: As mentioned above, this is where you can import report definitions (JSON files) into the Report Center. You can find many report definitions to import and experiment with by clicking here.
·Create report: If you can not find a report to suit a particular need, you can create a report from scratch and build from the ground up. To find out more about creating your own reports, go to the Quadrotech Nova User Guide.
Within a Report
There are separate actions you can take with reports by clicking on one. Those are:
·Pin: You can pin reports to the navigation bar to make them easily accessible, helpful for reports that you frequently view. Once pinned, they will appear as a Favorite Report in the navigation bar.
·Download PDF: Downloading reports to a PDF format makes report data easily sharable. Chart and table data are shown in full, with titles and descriptions as well as date of PDF generation.
·Print: Similar to downloading a PDF, you can print out your report featuring all data and details.
·Edit: Editing a report allows you to edit the data and details of a report and its' sections. You can:
oChange the title and description of a report.
oCreate a section/sections of a report.
oRearrange sections by clicking and dragging sections of a report to sort them to your needs.
oFilter the report to narrow all sections of the report to only certain organizations or organization groups, or by department, city, country, business unit etc. Find out more about filtering here.
oThe Share with Org slider allows the report to be either public (on) or private (off).
oSave the report.
oViewing the report takes you out of editing mode.
·Schedule a report to send to one or multiple users at a time of your convenience. Go to the Quadrotech Nova User Guide for more.
·Filter by org/org group temporarily in view mode
·Combine sections allows you to combine multiple chart sections into one.
|
|
NOTE: To combine charts, they need to be the same type i.e. only column charts can be combined with column charts. |
Within a Section
Sections have their own options. These are:
·Change the title and description of a section.
·Change the section type of a report section to a different data presentation type.
·Change the section width of a section to one third, half, two thirds or full width of a report.
·Clone a section of a report to make small changes to it.
·Delete a section of a report.
·Edit a section of a report by:
oPinning a section on the left hand navigation bar for quick access to your most used reports.
oFilter a specific section of a report by organization/organization group.
·Printing a section: Similar to printing a report, you can print an individual section.
·Downloading to CSV: A section can be downloaded to a CSV (Excel) document.
There are several ways in which you can filter a report or a report section. This helps to narrow the data of a report to a certain organization, or only show data for a particular department, business unit, city, country etc.
Filtering by Organization/Organization Group
You can filter the report to narrow all sections of the report, or specific sections of a report, to present data from certain organizations or organization groups. To do this on either a report or a section of a report:
1.Find the report and/or report section to apply the filters on.
|
|
NOTE: You can apply filters to any report, but you cannot save the application of filters on system reports. To save a filter on a system report, you must clone it first. |
2.Click on Filter, then click either Organization or Organization Group.
3.Select the Organization(s) or Organization Group(s) to apply to the report/report section.
4.If applicable, click Save, then close the report/report section.
Global Filters
You can also apply one or many filters (such as by department, country, business unit, etc.) to a report through Global Filters. You can apply global filters by either a Filter or a Filter Group.
§Applying a Filter includes only one data set to filter a report, such as a location, name, department, business unit, time created etc.
§A Filter Group is two or more filters being applied, either together or individually. An example of this is below.
To apply a global filter to a private or public report:
1.Go to the report you would like to apply global filters to.
2.Click Edit.
3.Click Filter, then Show Global Filters.
4.Click Add filter, and give the filter a name.
5.Click Add condition, and select what you would like to filter the report by. Fields differ by data source.
6.Select the Operator of the filter.
7.If applicable, then enter the filter value. This could be a numerical value, date or time span depending on the chosen operator.
8.Click Save, then View. The filter should then appear in the report, and the application of the filter will be presented as seen below:
To apply a global filter group to a report:
1.Go to the report you would like to apply global filters to.
2.Click Edit.
3.Click Filter, then Show Global Filters.
4.Click Add filter group, and give the filter group a name.
5.Click the plus icon, and create a filter as you would in the creating a filter steps above.
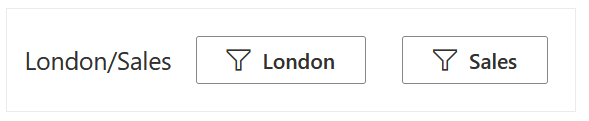
6.Add up to 10 filters to the group, then click Save, then View.
Below is an example of a filter group, with filters being created for London and Sales. Filters can be applied together or individually.
Global filters can only be applied to reports with the following data sources:
|
Alert |
Microsoft Entra ID Contacts |
Microsoft Entra ID Users |
Beacon |
BeaconLog |
|
Campaign |
Office 365 Mailboxes |
Office 365 Mobile Devices |
Office 365 Subscriptions |
Office 365 Users |
|
Organization |
OrganizationType |
Service Account |
Subscription |
SubscriptionItem |
|
TestResultsRecoveryLog |
User's manager |
Workload |
WorkloadLog |