|
2 |
On the Virtual Infrastructure view, that appears on the navigation panel, select a Virtual Center, datacenter, cluster, ESX host, resource pool, or one of the following containers: Datacenters, ESX Hosts, Resource Pools, or Virtual Machines. |
|
3 |
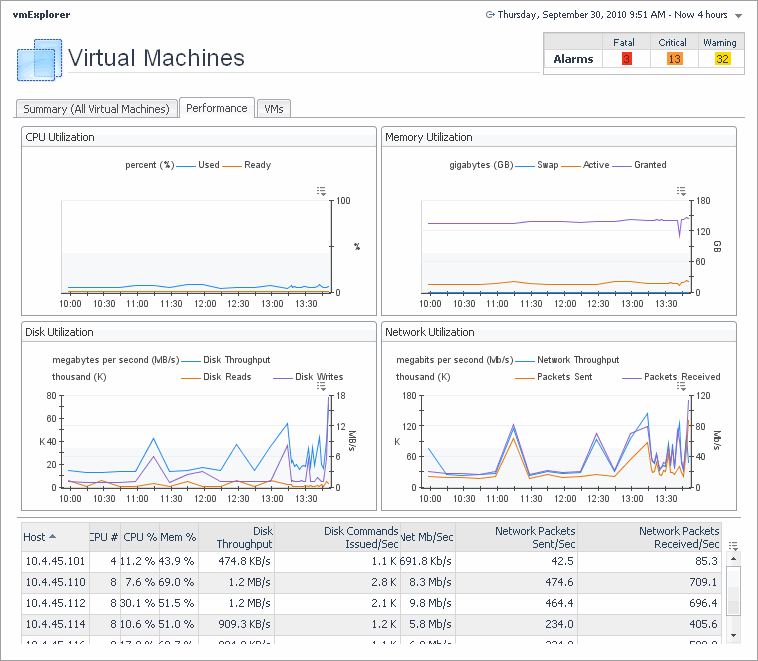
In the VMware Explorer, open the Performance tab. |
This tab is made up of the following embedded views:
|
• |
| |||
| |||
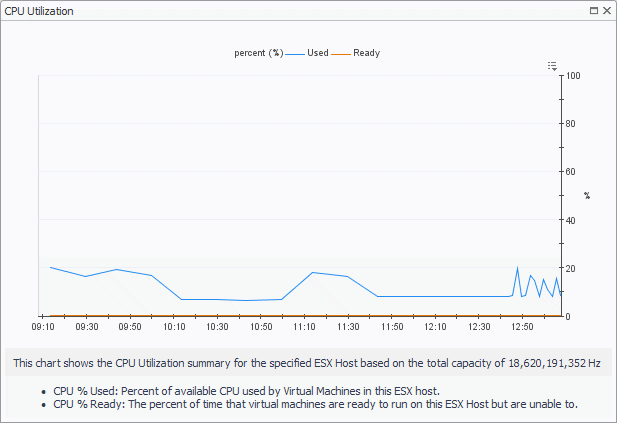
Figure 175. CPU Utilization graph
 |
|
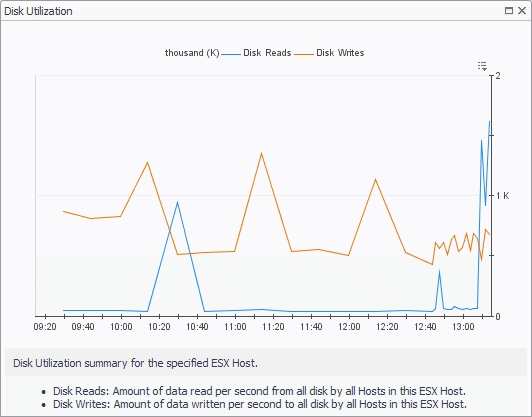
Shows the disk utilization summary for the selected component during a selected time period. | |||
| |||
| |||
Figure 176. Disk Utilization graph
 |
| |||
| |||
| |||
| |||
| |||
| |||
| |||
| |||
| |||
Figure 177. Disk Utilization graph
|
| |||
| |||
| |||
Figure 178. CPU Utilization graph
|
| |||
| |||
| |||
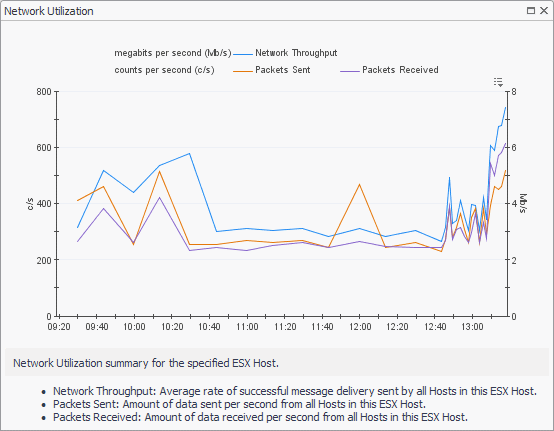
Figure 179. Network Utilization graph
 |
|
2 |
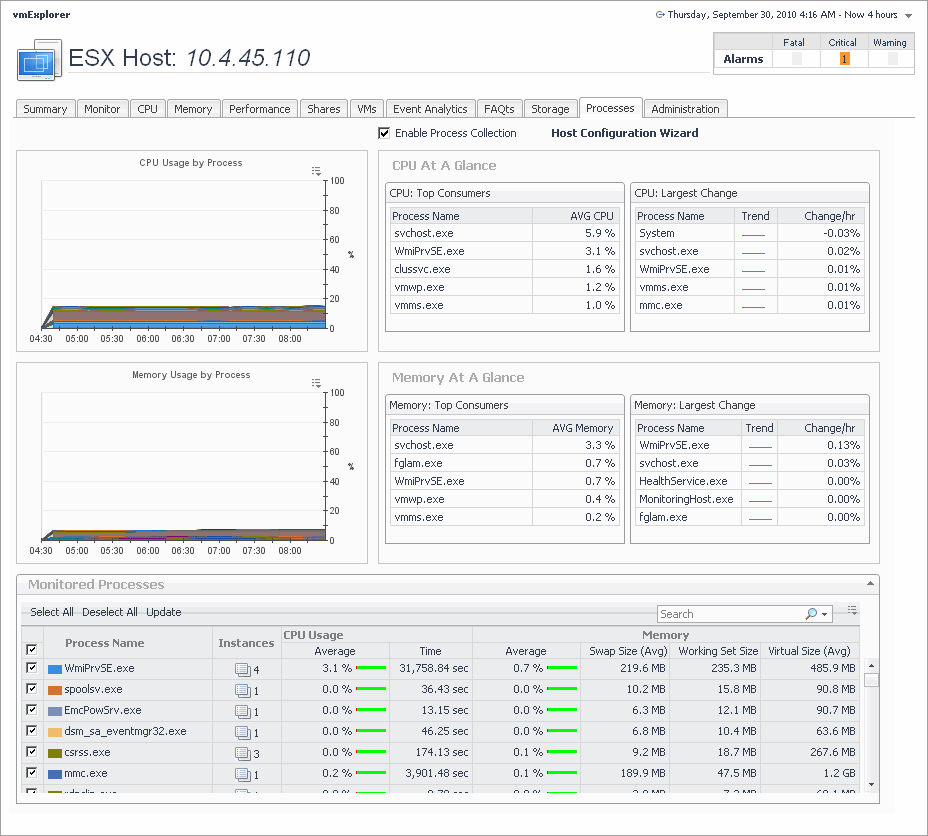
On the Virtual Infrastructure view, that appears on the navigation panel, select a Virtual Center, ESX host, or virtual machine instance. |
|
3 |
In the VMware Explorer, open the Processes tab. |
This tab is made up of several embedded views. For complete information about these views, see the Investigating Guest Processes User and Reference Guide.
At least one Related Objects view is provided in the VMware Explorer dashboard.
For more information about the VMware Explorer dashboard, see Investigating performance metrics .