|
1 |
|
3 |
|
3 |
Click Save changes at the bottom of the view. |
|
2 |
Click Set credentials. |
|
3 |
On the Edit Credentials pane, provide port connection details. This field can be left empty, unless the TCP/IP connection port is not the default port: 1443. |
|
5 |
Optional — Select whether an SSL connection should be used. The default is set to Optional. |
|
7 |
Click Set |
|
8 |
On the Connection Details pane, click Validate Connectivity. |
|
a |
Click Set User-defined Collections. |
|
e |
Click Set to return to the dialog box used for editing the instance’s credentials. |
|
a |
|
b |
Click Edit. |
|
c |
Select the check box Enable collecting VMWare CPU allocation data. |
|
e |
Click OK. |
|
• |
Manually, using a script (by clicking View script, copying the text and using it to grant privileges |
|
• |
By clicking the button Grant privileges. |
|
12 |
Click Save Changes. |
|
2 |
Click Alarms. |
|
• |
Normal — Store and display most alarms — essential and best practices; only critical and fatal statistical alarms. |
|
• |
Tuning — Store and display all SQL Server alarms sent to Foglight. |
|
• |
Performance — Store and display only availability and SQL PI related alarms. |
|
1 |
In the Alarms view, click the Sensitivity Level tab. |
|
4 |
Click Save changes. |
|
1 |
In the Alarms view, click the Sensitivity Level tab. |
|
2 |
Click View rules sensitivity mapping. |
|
3 |
If you want a record of the existing settings, click Report and export the settings to a file. |
|
5 |
Click Set sensitivity. |
|
7 |
Click Set. |
|
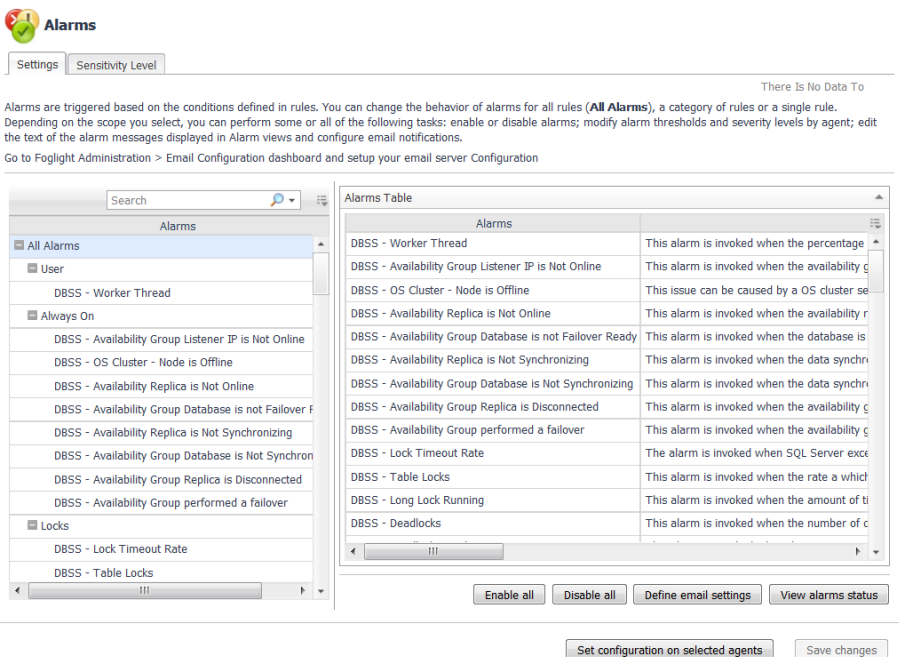
IMPORTANT: Avoid editing Foglight for SQL Server rules in the Administration > Rules & Notifications > Rule Management dashboard. Default rules may be modified during regular software updates and your edits will be lost. Always use the Alarms view. |
|
• |
All Alarms – Displays all rules with configured alarms and indicates whether alarms are enabled. In this view, you can enable or disable alarms for all the rules at once. You can also set email notifications and define mail server settings. |
|
• |
Category of rules – Displays a set of related rules with configured alarms. In this view, you can enable or disable alarms and also set email notifications for the category of rules. |
|
• |
Rule name – Displays the alarm status for the selected rule. If the rule has multiple severity levels, displays the threshold configured for each severity level. In this view, you can enable or disable the alarm, edit the alarm text, and edit severity levels and their thresholds. You can also set email notifications for the alarm. |
|
1 |
In the Alarms view, click the Settings tab. |
|
Click the rule. In the Alarms Settings tab, click the link that displays the alarm status. Select Enabled or Disabled from the list and click Set. |
|
4 |
Click Save changes. |
|
TIP: If you want to review the thresholds for all Foglight for SQL Server rules in a single view, use the Rule Management dashboard. In the navigation panel, click Homes > Administration, then click Rules. Type DBSS in the Search field to see the list of predefined rules for SQL Server databases. For rules with severity levels, you can see the threshold values set for each level. If you want to edit threshold values, return to the Alarms view. Edits made directly to the default rules may be overwritten during software upgrades. |
|
1 |
In the Alarms view, click the Settings tab. |
|
3 |
Click the Alarms Settings tab. |

|
Click Enhance alarm. Select the check boxes for the severity levels you want enabled and set the threshold values. Click Set. | |
|
Click Edit beside the agent name that has the values you want to copy. Select Set for all agents in table and click Set. |
|
6 |
Click Save changes. |
|
1 |
In the Alarms view, click the Settings tab. |
|
3 |
Click the Alarm Settings tab. |
|
4 |
Click Enhance alarm. |
|
6 |
Click Set. |
|
7 |
Click Save changes. |
|
• |
|
1 |
In the Alarms view, click the Settings tab. |
|
Click All Alarms. In the Alarms Settings tab, click the Define Email Settings button. Select either Enabled or Disabled from the Alarms notification status list. Click Set. | |
|
Click a category. Click the Define Email Settings button. Select either Enabled or Disabled from the Alarms notification status list. Click Set. | |
|
Click a rule. In the Alarms Settings tab, click the Define Email Settings tab. Click the link that displays the alarm notification status. Select Enabled or Disabled and click Set. |
|
4 |
Click Save changes. |
|
1 |
In the Alarms view, click the Settings tab. |
|
Click a rule. Click the Define Email Settings tab.
|
|
4 |
If you selected All Alarms or a category, in the Email Notification Settings dialog box, do one of the following: |
|
• |
To change the severity levels that warrant an email notification, from the Messages will be enabled for severities box, select the desired levels of severity. |
|
• |
To configure the same email recipients and message for all severity levels, click Configure settings for all severities and then click All severities. |
|
• |
To configure different email recipients and messages for each of the severity levels, click Configure severity specific settings and then click a severity level. |
|
• |
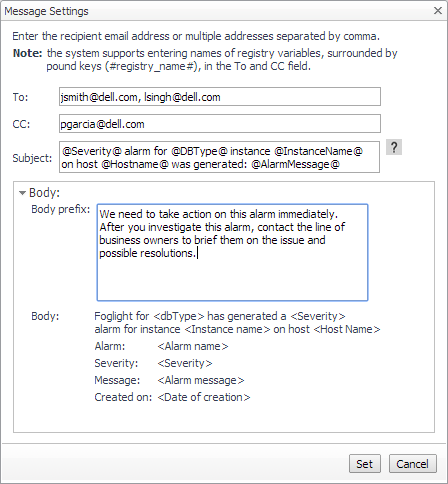
To — Type the addresses of the people who need to take action when this alarm triggers. |
|
• |
CC — Type the addresses of the people who want to be notified when the alarm triggers. |
|
• |
Subject — Optional. Edit the text of the subject line to better suit your environment. Avoid editing the variables, which are identified with the @ symbol. |
|
• |
Body Prefix — Optional. Add text that should appear above the alarm information in the body of the email. |
|
6 |
Click Set to save the message configuration and close the dialog box. |
|
8 |
Click Save changes. |
|
1 |
On the navigation panel, under Dashboards, click Administration > Rules & Notifications > Manage Registry Variables. |
|
2 |
Click Add. |
|
3 |
|
4 |
In the Name field, enter a name, for example: EmailTeamName |
|
5 |
Click Next. |
|
6 |
Select Static Value. |
|
8 |
Click Finish. |
|
1 |
If you are continuing from Defining variables to contain email recipients, the registry variable is already open for editing in the Edit Registry Variable dashboard. |
|
TIP: To edit a different variable, navigate to the Administration > Rules & Notifications > Manage Registry Variables dashboard, click the variable name, and select View and Edit Details. |
|
3 |
Select a schedule, for example: End of Day |
|
4 |
Click Next. |
|
5 |
Select Static Value. |
|
7 |
Click Finish. |
|
1 |
|
2 |
|
3 |
|
4 |
Click Set configuration on selected agents. |
|
7 |
Click Apply. |
|
IMPORTANT: Avoid editing Foglight for SQL Server rules in the Rule Management dashboard. These rules may be modified during regular software updates and your edits will be lost. Always use the Alarms view. |
|
1 |
|
3 |
Type DBSS in the Search field to see the list of predefined rules for SQL Server databases. |
|
4 |
To see the full rule definition, click a rule and then click View and Edit. |
|
5 |
In the Rule Detail dialog box, click Rule Editor. |
|
7 |
Click Cancel to avoid changing the rule unintentionally. |
