|
1 |
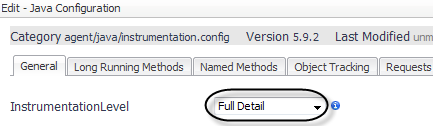
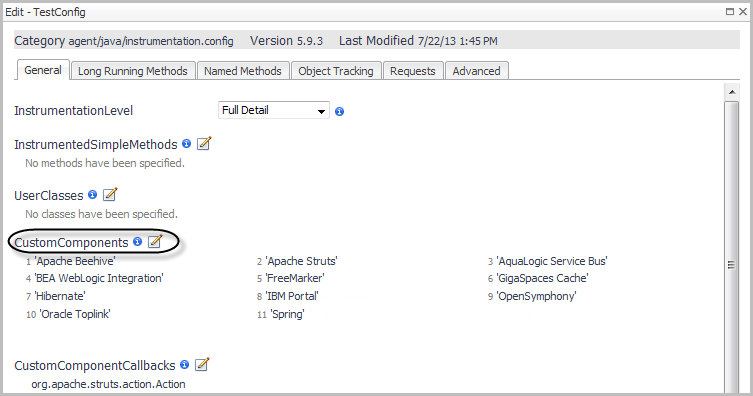
On the General tab of the Edit dialog box, select the instrumentation level from the InstrumentationLevel list. |
|
• |
Full Detail — Instruments at full detail level. All methods in the call tree are captured. |
|
• |
Component Detail — Instruments at the component level only. Methods from defined component technology, including custom components, are captured. |
|
• |
Basic Detail — Instruments at a basic level. Only request metrics for HTTP, JMS, and RMI request are collected. No other component or full detail methods are captured. |
|
• |
No Detail — Turns off instrumentation that is not essential for running an agent. As a result, no request metrics are collected, and single traces call trees cannot be captured. |
|
NOTE: As a result of setting instrumentation to this level, no data is displayed in the Application Servers Monitor > Requests tab. |
|
2 |
Click Save. |
|
1 |
|
4 |
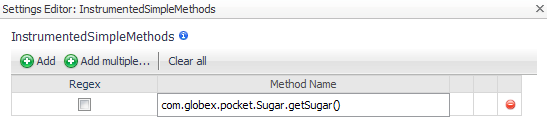
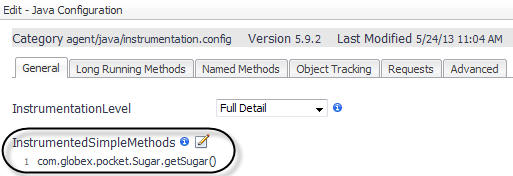
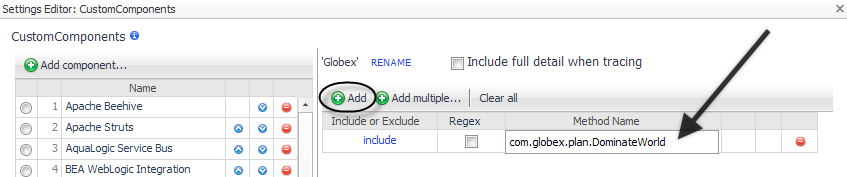
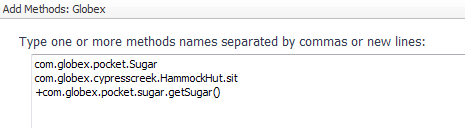
Click in the Method Name box and type the name of the method you want to instrument. For example, in the following image, the getSugar() method is instrumented even if it is detected as a simple method. |
|
5 |
Click OK. |
|
6 |
Click Save. |
|
1 |
|
3 |
|
4 |
|
5 |
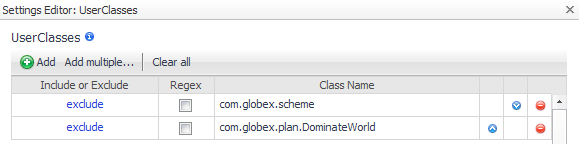
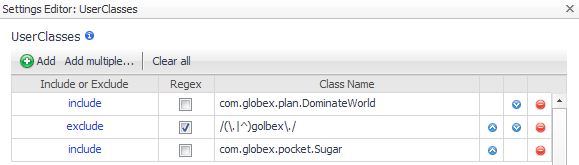
Click the Class Name box and type the name of the class you want to exclude. |
|
TIP: For more information about regular expressions, see the Appendix: Regular Expressions in the Foglight for Application Servers User Guide. |
|
6 |
In the Settings Editor dialog box, click OK to save your changes to the user class instrumentation. |
|
7 |
|
1 |
|
a |
Click |
|
4 |
|
1 |
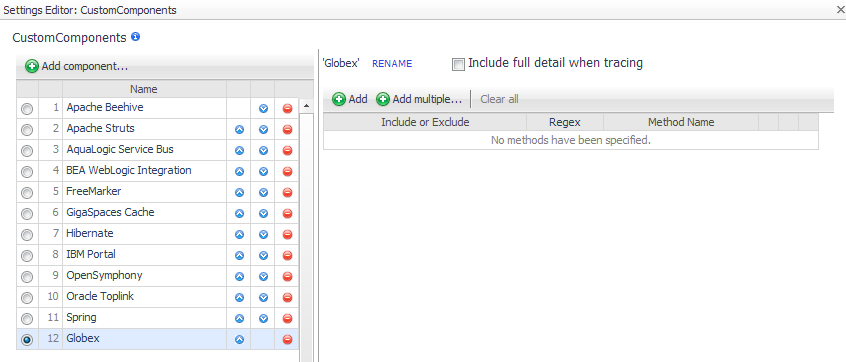
Edit CustomComponents. Specify the name of each component in a method list, either by entering the name or by forming a regular expression that matches the name or pattern. Enter the include element before each item in the list. For example: |
|
2 |
After editing the instrumentation.config settings, ensure that it is read by restarting the instrumented application servers. |
