Top Activity Dashboard
 |
 |
Top Activity Dashboard
Top Hash Tab
 |
 |
Top Hash Tab
The Top Hash information is provided in a table. The Top Hash table has the same columns and drilldowns as the Top SQL Table.
For complete information about the required parameters, see “Adaptive Server Enterprise configuration parameters” in the Foglight for Sybase Release Notes.
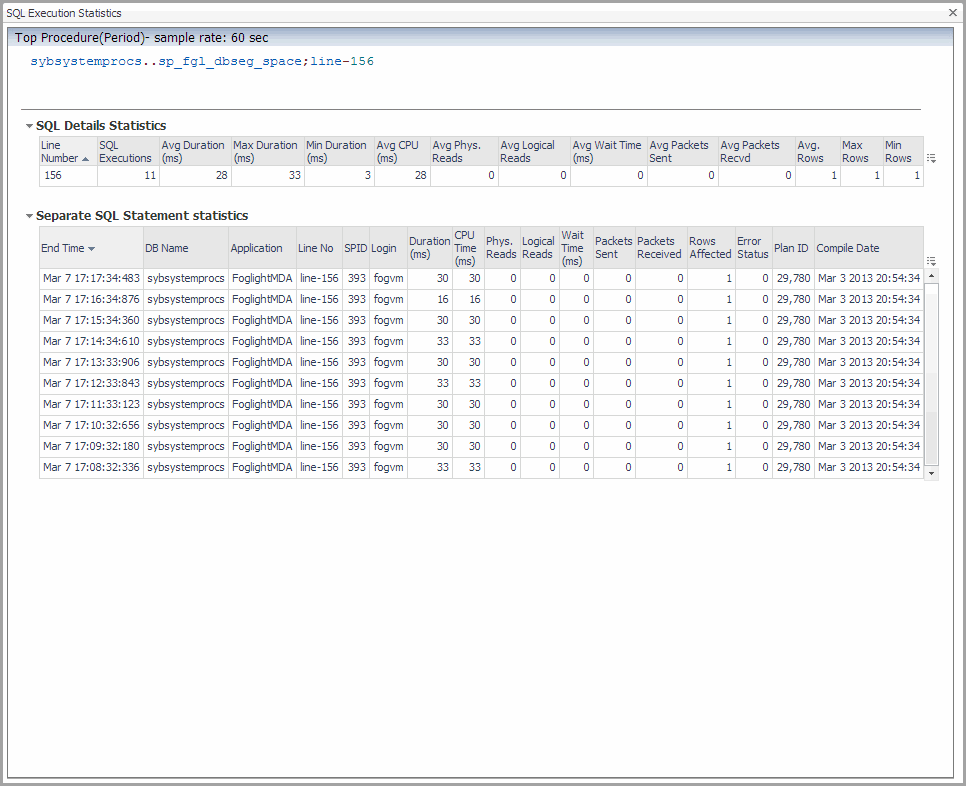
Selecting an option button for an individual SQL text line shows the SQL Execution Statistics Dialog Box.. This dialog box shows the SQL details about a selected line of SQL text.
Figure 4. SQL Execution Statistics Dialog Box.
Top Hash Filters
The Top Hash filters are the same as the Top SQL Filters.
Server Statistics Pane
The Server Statistics pane on the Top Hash tab is the same as the Server Statistics Pane on the Top SQL tab.
For more information on the Server Statistics pane, click the ? toward the top left of the pane.
Top SQL Tab
 |
 |
Top SQL Tab
The Top SQL information is provided in a table, which is sorted by the Avg Duration (ms) column.
Figure 5. Top SQL Tab
Top SQL Table
Top SQL Filters
The following rules apply to the search methods:
For example, type -sa to exclude sa user
For example, to find all abc and def users, type "abc,def"
The search process is carried out using the following steps:
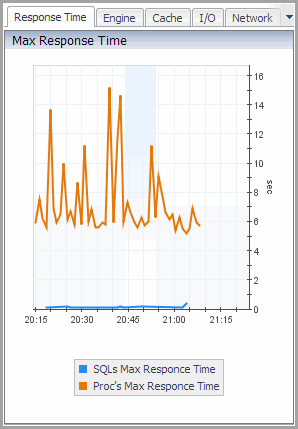
Sybase_MDA Agent Max Response Time Graph View
Purpose — The Max Response Time graph plots the SQL queries maximum response time and the SQL procedures maximum response time, for the database, over the specified time range.
Figure 6. Sybase_MDA Agent Max Response Time Graph View
Description of the View
Table 12. Max Response Time View
SQLs Max Response Time. The maximum amount of time (in ms) it took the database to respond to a SQL statement at a given time, plotted over the specified time range.
Proc’s Max Response Time. The maximum amount of time (in ms) it took the database to respond to a procedure SQL statement at a given time, plotted over the specified time range.
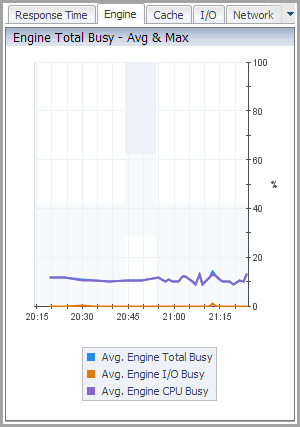
Sybase_MDA Agent Engine Total Busy Graph View
Purpose
Figure 7. Sybase_MDA Agent Engine Total Busy Graph View
Description of the View
Table 13. Sybase_MDA Agent Engine Total Busy Graph View Description
Avg. Engine Total Busy. The percent of the engine (total) that was busy at a given time, plotted over the specified time range.
Avg. Engine I/O Busy. The percent of the engine I/O that was busy at a given time, plotted over the specified time range.
Avg. Engine CPU Busy. The percent of the engine CPU that was busy at a given time, plotted over the specified time range.
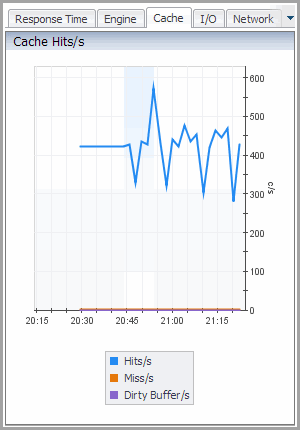
Sybase_MDA Agent Cache Hits/s Graph View
Purpose
Figure 8. Sybase_MDA Agent Cache Hits/s Graph View
Description of the View
Table 14. Sybase_MDA Agent Cache Hits/s Graph View Description
Hits/s. The number of hits per second, plotted over the specified time range.
Miss/s. The number of misses per second, plotted over the specified time range.
Dirty Buffer/s. The number of dirty buffers per second, plotted over the specified time range.
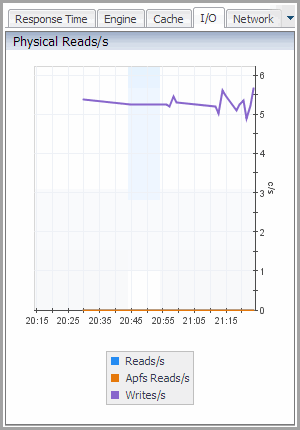
Sybase_MDA Agent I/O Physical Reads Graph View
Purpose
Figure 9. Sybase_MDA Agent I/O Physical Reads Graph View
Description of the View
Table 15. Sybase_MDA Agent I/O Physical Reads Graph View Description
Reads/s. The number of physical reads per second, plotted over the specified time range.
Apfs Reads/s. The number of APFs per second, plotted over the specified time range.
Writes/s. The number of physical writes per second, plotted over the specified time range.
Sybase_MDA Agent Network Graph View
Purpose
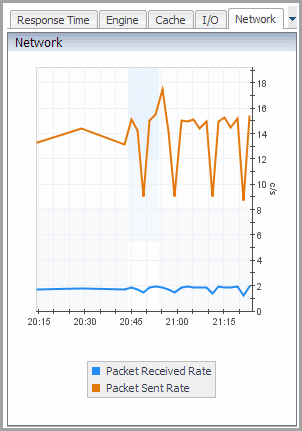
Figure 10. Sybase_MDA Agent Network Graph View
Description of the View
Packet Received Rate. The packet received rate, plotted over the specified time range.
Packet Sent Rate. The packet sent rate, plotted over the specified time range.
Sybase_MDA Agent Waits Graph View
Purpose
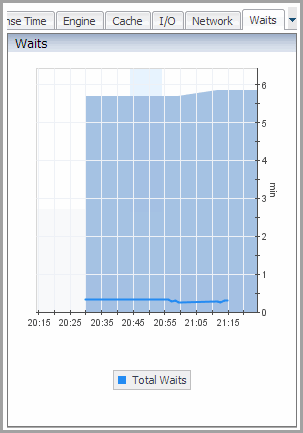
The Waits graph plots the total waits for the database over the specified time range.
Figure 11. Sybase_MDA Agent Waits Graph View
Description of the View
Table 17. Sybase_MDA Agent Waits Graph View Description
Total Waits. The total waits, plotted over the specified time range.
Sybase_MDA Agent Active Users Graph View
Purpose
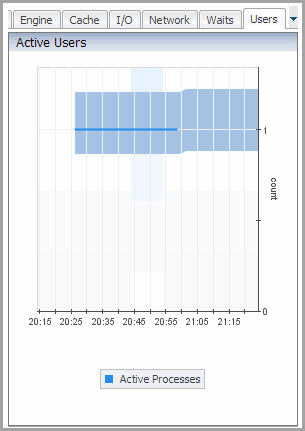
Figure 12. Sybase_MDA Agent Active Users Graph View
Description of the View
Table 18. Sybase_MDA Agent Active Users Graph View Description
Active Processes. The total number of active users at a given time, plotted over the specified time range.
Zooming In on a Data Point Using the Filter Pane
If you click a data point on any plot line in a Filter pane graph to zoom in on that data point, the Zoom-in on a data point check box is selected and the exact time at which the data point was recorded is displayed in the Selected data metric point box.
You can adjust the number of seconds for which you want data displayed before and after the selected data metric point by adjusting the value in the Metric point time margins (sec) box.
To reset the Filter pane to the default values at any time, click Reset.
For more information on the Filter pane, click the ? at the top right of the pane.
SQL Execution Statistics Dialog Box
This dialog box shows additional information about a selected SQL statement. This dialog appears when you select an option button on the Top Hash, Top SQL, or the Top Procedures tab.
Figure 13. SQL Execution Statistics Dialog Box
This column is only available on the Top Activity > Top Procedures tab.
Server Statistics Pane
On any graph, hover over a point on a plot line for precise details about that point.
For more information on the Server Statistics pane, click the ? toward the top left of the pane.
Top Procedures Tab
 |
 |
Top Procedures Tab
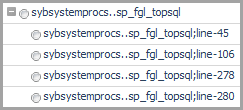
The top procedures information is provided in a table, which is sorted by the Avg Duration (ms) column. The Top Procedures table has the same columns as the Top SQL Table. In addition, the SQL Text column provides a navigation tree for each top procedure SQL statement, which contains the procedure name data. Expanding the root procedure node lists the line numbers containing the SQL statements in the procedure for which the execution statistics are available.
Figure 14. Expanded root procedure node list
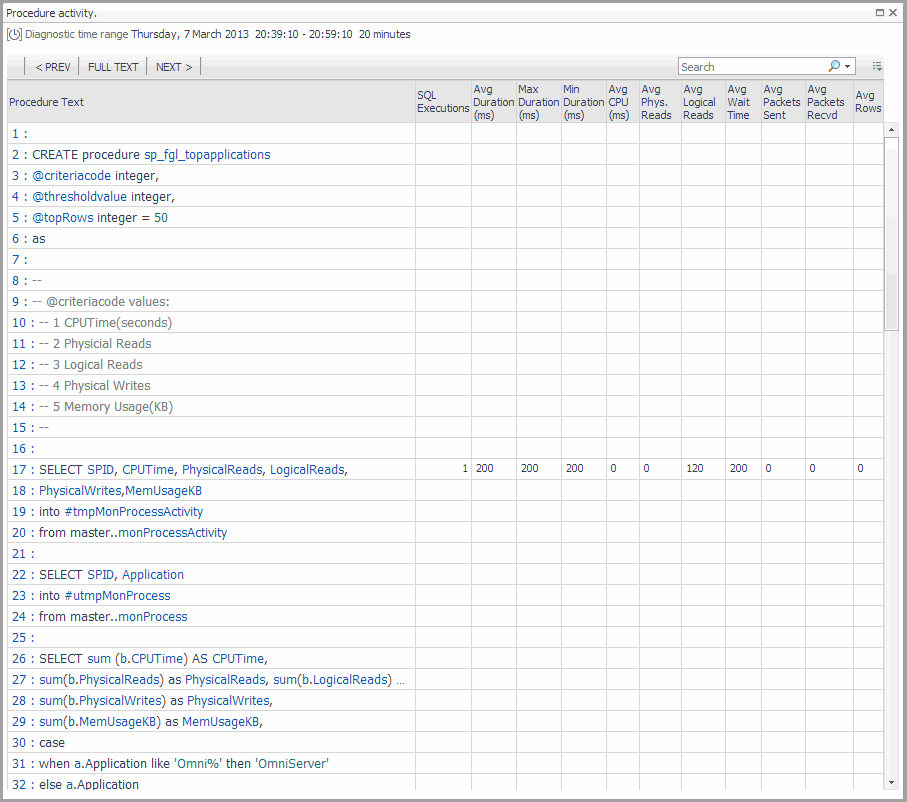
Click an individual line to display the stored procedure text with its execution statistics in the Procedure Activity Drilldown. This behavior is enabled using the call back functionality. To use this feature, you need to configure a set of call back parameters. For more information, see Setting Callback Connection Properties.
Selecting an option button for an individual line shows the SQL Execution Statistics Dialog Box. This dialog box shows the SQL details about a selected procedure.
For more information, see Setting Data Retrieval Properties.
Figure 15. SQL details
Top Procedures Filters
The Top Procedures filters are the same as the Top SQL Filters.
Procedure Activity Drilldown
Figure 16. Procedure Activity Drilldown
Navigate through the text and statistics using PREV, FULL TEXT, and NEXT.
Server Statistics Pane
The Server Statistics pane on the Top Procedures tab is the same as the Server Statistics Pane on the Top SQL tab.
For more information on the Server Statistics pane, click the ? toward the top left of the pane.


