Exploring Web Monitor services
Foglight Web Monitor extends the Service Operations Console. When a Web Monitor service is defined and you also have Foglight for APM installed, you can visualize the Web Monitor transactions visualized in the Service Operations Console and on the Transactions dashboard, available with Foglight for APM. For more information about the Service Operations Console, see the Foglight User Guide. For details about Foglight for APM, see the Foglight Monitoring Application Performance User and Reference Guide.
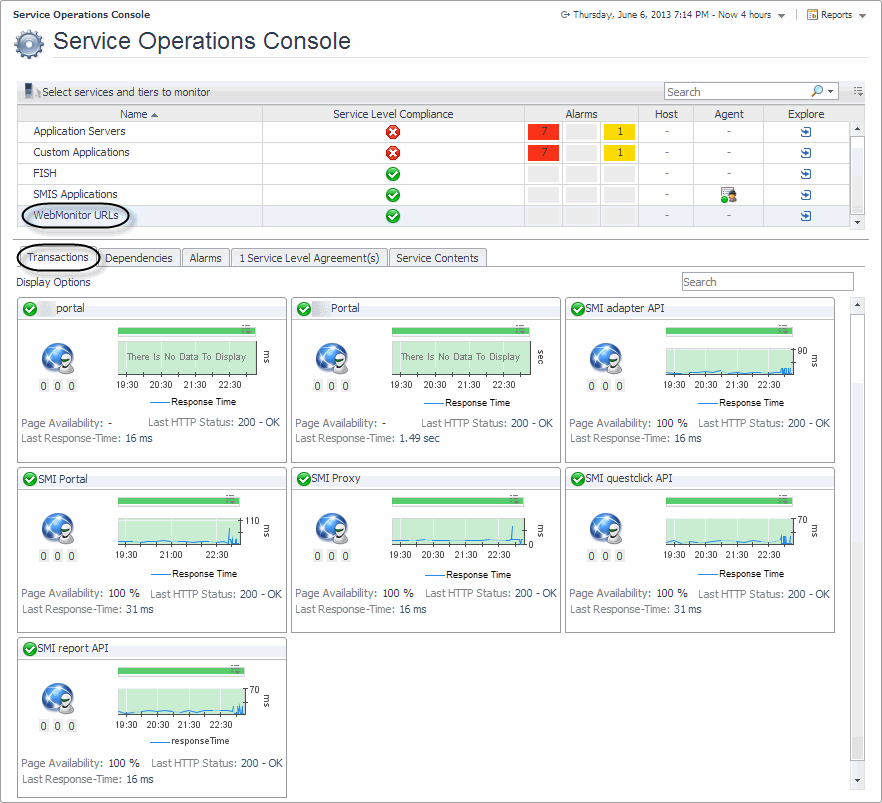
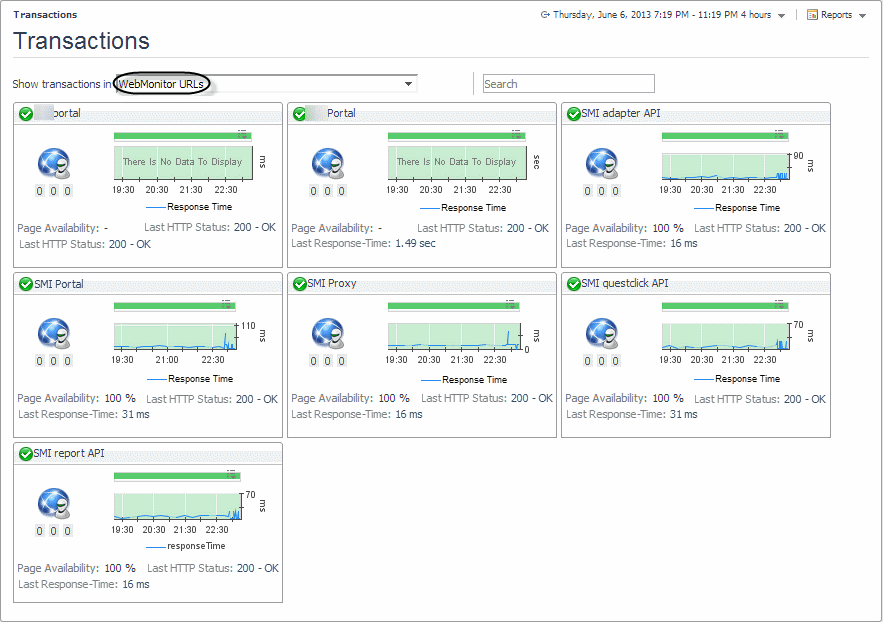
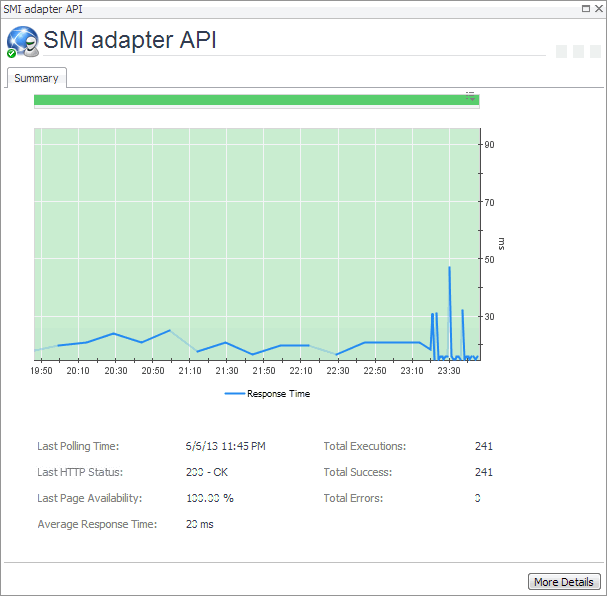
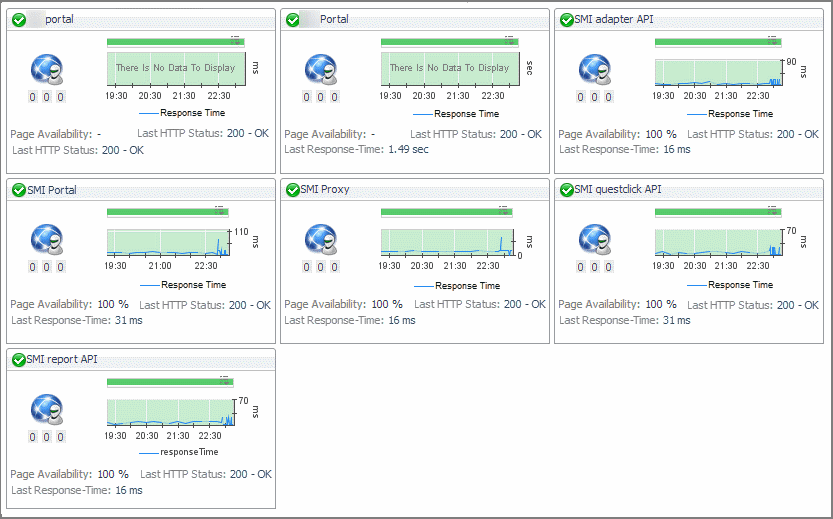
Start by navigating to the Service Operations Console dashboard and select a Web Monitor service. The Web Monitor tiles appear on the Transactions tab. The information displayed on these tiles helps you visualize how your Web transactions are performing, and to predict potential bottlenecks.
For more information about these views, see Web Monitor Service Operation Console and Foglight for APM Transactions views.
|
• |
On the navigation panel, click Services > Service Operations Console. |
|
• |
On the navigation panel, click APM > Transactions. |
Generating reports
For complete information about Foglight reports, see the Foglight User Guide.
Configuring Web Monitor agent properties
|
CAUTION: With the exception of “Force TLSv1” and “Data Collection Scheduler” agent properties, you must NOT change any properties through the Agent Status dashboard, unless instructed by Quest Customer Support. You should always go to Web Monitor > Administration Home > Transaction Management dashboard to manage your collection of monitored web sites. |
The Web Monitor Agent includes the following groups of agent properties:
|
• |
Settings
The Settings properties specify general settings the Web Monitor agent needs to start collecting data from monitored Web sites.
|
• |
Agent Location: The name of the host on which the Foglight Agent Manager associated with this Web Monitor Agent instance is running. |
|
• |
Agent Location Alias Name: The alias name of the host on which the Foglight Agent Manager is running. |
|
• |
Force TLSv1: Indicates whether to use the TLSv1 or TLSv1.2 protocol. When set to “True”, the TLSv1 protocol is used (default value). |
|
• |
URL List: This list also appears on the Transaction Management dashboard. Any changes you make to that collection in the Web Monitor Agent properties is automatically reflected on the Transaction Management dashboard and the other way around. For more information about this dashboard, see Exploring your collection of monitored Web sites. |
|
• |
URL: The URL of the monitored Web site. |
|
• |
Alias Name: The name you want to associate with the transactions with this Web site. |
|
• |
Display Name: The display name of the transaction. |
|
• |
Connection Time Out: The maximum amount of time in milliseconds the agent instance can wait for establishing an HTTP connection to the monitored Web site. The value 0 indicates the agent will take the default connection time out. The default is 5 seconds. |
|
• |
Read Time Out: The maximum amount of time in milliseconds the agent instance can wait to receive the data from the monitored URL. For instance, If “Is Page Get Header Only” is enabled, the value specified in “Read Time out” value will be used to read the header only (this is what "Is Page Header” does). If “Is Page Get Header Only” is disabled and “Read Timeout” is kept as 0, the timeout to read content will be 10 seconds. If “Read Timeout” is 30 seconds, the timeout to read the content will be 30 seconds. |
|
• |
Is Get Page Header Only: Indicates to the Web Monitor Agent whether to collect the page header only. |
|
• |
Custom Header: The custom URL header. Also, multiple custom header is supported. If you have more than one custom headers in the URL you are monitoring, you may use the following in the Customer Header column: property=value, property=value |
|
• |
Enable Content Validation: Instructs to the Web Monitor Agent whether to enable or disable content validation. |
|
• |
Expect Content: If content validation is enabled for the agent instance that monitors this URL, and the expected content type is HTML-based, type html into this column. Also, a text string could be used such as “laptop” and type laptop into this column. When the monitoring agent detects binary content or the text string at this address, the validation fails and the agent logs an error message. If you do not want to enable content validation, leave this column empty. |
|
• |
Enable Unexpected Content Validation: Instructs to the Web Monitor Agent whether to enable or disable unexpected content validation. |
|
• |
Unexpected Content: If unexpected content validation is enabled for the agent instance that monitors this URL, and the unexpected content type is HTML-based, type html into this column. Also, a text string could be used such as “laptop” and type laptop into this column. When the monitoring agent detects binary content or the text string at this address, the validation fails and the agent logs an error message. If you do not want to enable unexpected content validation, leave this column empty. |
|
• |
Enable Auth: Indicates to the Web Monitor Agent whether to enable user authentication. If enabled, you must create a credential to provide the agent with a user name and password needed to access this Web site. For more information, see Configuring credentials to access Web sites requiring user authentication. |
|
• |
Enable Proxy: Indicates to the Web Monitor Agent whether to use a proxy server to access this URL. If enabled, you need to create a credential to provide the agent with a user name and password needed to access this proxy server. For more information, see Configuring credentials for accessing Web sites through proxy servers. |
|
• |
Proxy Server: The server handling incoming requests from clients. |
|
• |
Proxy Type: The protocol used to access the proxy server. Currently the only supported protocol is HTTP. |
|
• |
Proxy Port: The port number the proxy server listens on for incoming requests. |
|
• |
Enable Proxy Auth: Indicates if the proxy needs authentication. |


