Data Collection Scheduler
The Datacenter Collection Scheduler agent properties specify the data frequency settings the agent uses to read monitored log files.
|
• |
Collector Config: A list containing the data collectors the agent uses. Each entry in the list includes the following columns: |
|
• |
Collector Name: The name of the collector the agent uses to gather data. |
|
• |
Default Collection Interval: The number of milliseconds, seconds, minutes, hours, or days during which the agent collects data. |
|
• |
Time Unit: The time unit associated with the Default Collection Interval. |
|
• |
Fast-Mode Collection Interval: The number of milliseconds, seconds, minutes, hours, or days during which the agent collects data when working in the fast collection mode. |
|
• |
Fast-Mode Time Unit: The time unit associated with the Fast-Mode Collection Interval. |
|
• |
Fast-Mode Max Count: The maximum number of the times the agent can stay in fast collection mode. |
FileLogMonitor configuration example
This example provides the configuration settings for monitoring the FglAM log files on a UNIX® system for WARN and ERROR records. The FglAM log files are located in the /home/user/FglAM/state/default/logs folder. FglAM log records have a date at the beginning of each record that look like this:
This format can be set as the regular expression for the record separator.
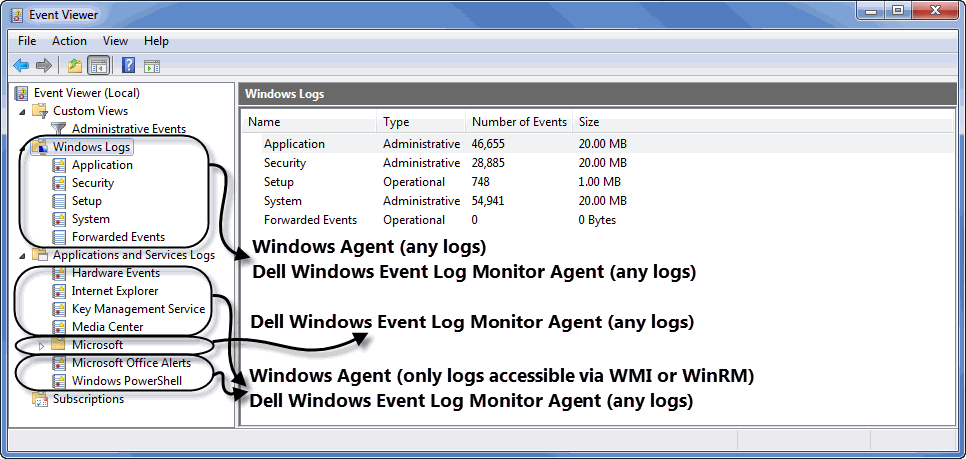
Configuring Windows Event Log Monitor agent properties
For more information about the Windows Agent, see the Managing Infrastructure User and Reference Guide.
This agent includes the following groups of agent properties:
For a configuration example, see WindowsEventLogMonitor configuration example.
Monitored Hosts
The Monitored Host properties specify the hosts whose log files you want to monitor with this the agent.
|
• |
Hosts: A list specifying the hosts monitored by the agent instance. Typically you want a cloned list that is associated with a specific agent instance. Each entry in the list includes the following columns: |
|
• |
Host: The name of the monitored host or its IP address. |
|
• |
Host name override: The host name under which this host’s data is stored in the data model. This property is optional. |
|
• |
Network Operation Timeout (seconds): The maximum amount of time in seconds given to the agent for each phase of a collection attempt. This includes uploading the native executable, scanning for log entries, and retrieving log content. |
|
• |
Collect System ID: This property indicates to the agent whether or not to collect a unique system ID from this system. This is not desirable when monitoring Hyper-V systems, as some Hyper-V systems use the same ID for multiple systems, preventing them from being unique. |
|
• |
Remote Collector Executable: The name of the agent native executable on the remote monitored host. This property is optional. If not specified, a random name is used. Configure this property only if you need to set a specific name for the executable so that you can write a sudo rule for it, or to have it uploaded to a non-default directory. In that case, provide a complete a full path name along with the file name. |
|
• |
Maximum Record Match Count Per Log File: The maximum number of records the agent reads per log file. Setting this value to a reasonable number of records (for example, 200) allows you to control the amount of time and resources the agent spends to read monitored logs during a single collection interval, and to prevent bottlenecks during data collection. If you do not want to specify a limit, type -1. |
|
• |
Backlog of Events (seconds): The length of time in the past to start collecting data from until the present moment, if not already processed. Specifying a reasonable amount of time using this property (for example, 3,600 seconds or one hour) allows you to bring in historical data, providing a point of reference for future collections. |
|
• |
Max Logs Processing Time (seconds): The amount of time in seconds given to the agent for a data collection attempt. Setting this value to a reasonable number of seconds (for example, 120) allows you to control the amount of time the agent spends to read monitored logs during a single collection interval, and to prevent bottlenecks during data collection. |

