Creating agent instances
After a successful agent deployment, you can proceed to create agent instances using the agent types included in the newly-deployed infrastructure agent package: UnixAgentPlus, UnixAgent, WindowsAgent, or MultiHostProcessMonitorAgent.
The recommended method for creating Foglight for Infrastructure agents for the hosts that you want to monitor is by using the Add Monitored Host wizard or the Add Monitored Host - List wizard. For detailed information about these wizards, see sections Adding a monitored host and Adding multiple monitored hosts.
For generic information about creating agent instances and editing properties using the Agent Status dashboard, see “Create agent instances on monitored hosts” in the Administration and Configuration Help. Edit the agent instance properties, as necessary for each monitored host. For generic information about editing agent properties, see “Edit instance-specific agent properties” in the Administration and Configuration Help.
For detailed information about Foglight for Infrastructure agents, see About the WindowsAgent, About the UnixAgentPlus, About the UnixAgent, and About the MultiHostProcessMonitorAgent.
Defining credentials
If you create agent instances using the Add Monitored Host wizard or the Add Monitored Host - List wizard, the credentials setup is part of the wizard’s flow. For details, see sections Adding a monitored host and Adding multiple monitored hosts.
Activating the agent
|
TIP: The activate operation fails if the credentials are not properly defined. Click Get Log to see the list of errors and warnings. |
Monitoring the infrastructure
|
• |
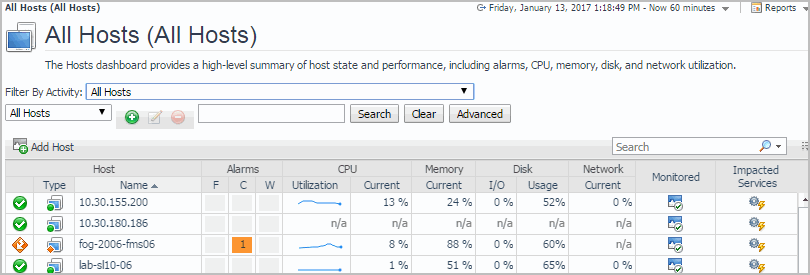
On the navigation panel, under Dashboards, click Infrastructure > Hosts > Hosts. |
|
NOTE: The Add Host icon and the Monitored column are available only if Foglight for Infrastructure is installed. |
The Monitored column shows whether the host is already configured for monitoring , or is not monitored
yet (in which case, you can click the icon to add a monitored host).
Once sufficient data has been collected, the CPU (Utilization, Current), Memory Current, Disk (I/O, Usage), and Network Current columns and the Utilization sparklines display the resource utilization for each monitored host. Hover over each of these columns to see the resource utilization graph for a host.

