Converse agora com nosso suporte
Chat com o suporte

Foglight for DB2 (Cartridge) 5.9.5.20 - User Guide

Introduction to Foglight for DB2 LUW Using Foglight for DB2 LUW Reference
Dashboards and Views Collections and Metrics
CF Locks Collection CF Memory Pools Collection CF Resource Usage Collection Current Agents Details Collection Agents Summary Collection Current Locks Wait Collection Database Bufferpools Summary PS Collection Database Configuration Collection Database Tablespaces Collection Database Tablespaces Summary Collection Database Usability Collection Database Parameters Collection Database Instance Parameters Collection Database Instance Registry Variables Collection Database Tablespaces BP Collection FCM Activity Collection FS DB Storage Collection FS DB Storage Summary Collection FS Instance Storage Collection FS Storage Collection FS Storage Summary Collection General Activity Collection HADR Activity Collection Host Properties Collection OS General Collection Instance Activity Collection Instance General Collection Instance Nodes Collection Instance Usability Collection IO Activity Collection License Details Collection Log Activity Collection Log File Collection Log Message Collection Messages Count Collection Monitor Switches Collection OS DB2 General Process Collection Partition Tablespaces Summary Collection Partition Usability Collection pureScale Alerts Collection Top SQLs Collection Query Agents Details Collection Database Partition Activity Collection DB2 Partition Subcategories Wait Collection History Locks Wait Collection History Locks Summary Collection Instance Memory Collection Instance Memory Pool Collection Instance Memory Summary Collection Instance Memory Total Collection Database Memory Collection Database Memory Pool Collection Database Memory Pool DB Collection Database Memory Summary Collection Database Memory Total Collection Database Buffer Pools Collection Database Tables Collection Database Partition Backup Collection Database Tables Global Collection Database Applications Collection

Log Drill-down

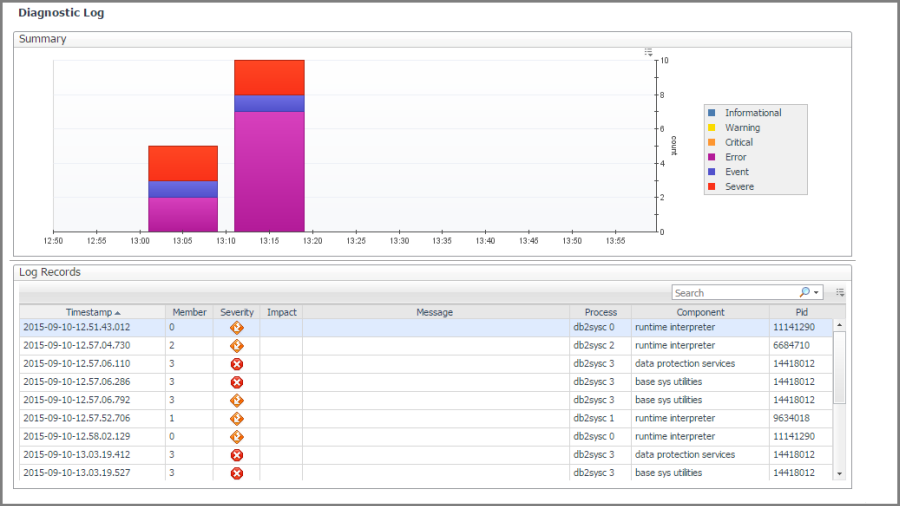
The Log drill-down provides a diagnostic graph and log of database log activity. Records displayed are those configured in the Diagnostic Log administration screen.

On the Database home page toolbar, click Log.

This pane provides the following views:

Displays a graphical history of the informational, warning, critical, error and other counts graphed over a period.

Displays information log table messages in tabular form.

Timestamp. The exact time and date when the message log was created.
Member. Member where the message came from.
MSGNUM. Message number
Severity. Severity of the message.
Type. Message type.
Message. Text of the message.
Pid. Process ID.
Process. Which DB2 process triggered the message.
TID. Timestamp identification number.
Application ID. Identifies the application from which the message originated.

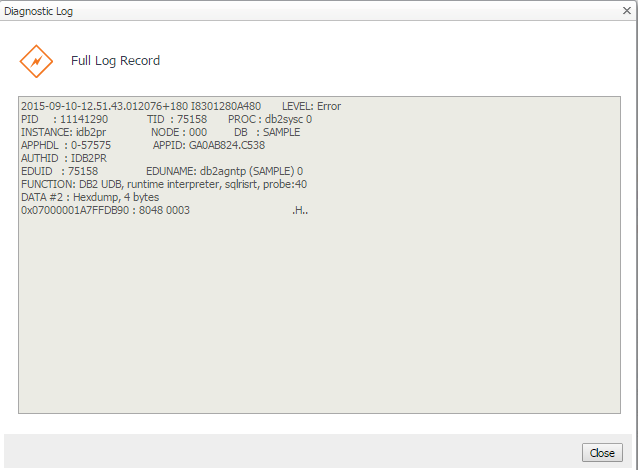
Selecting any record will open a pop-up with the full log record.

Configuration Drill-down

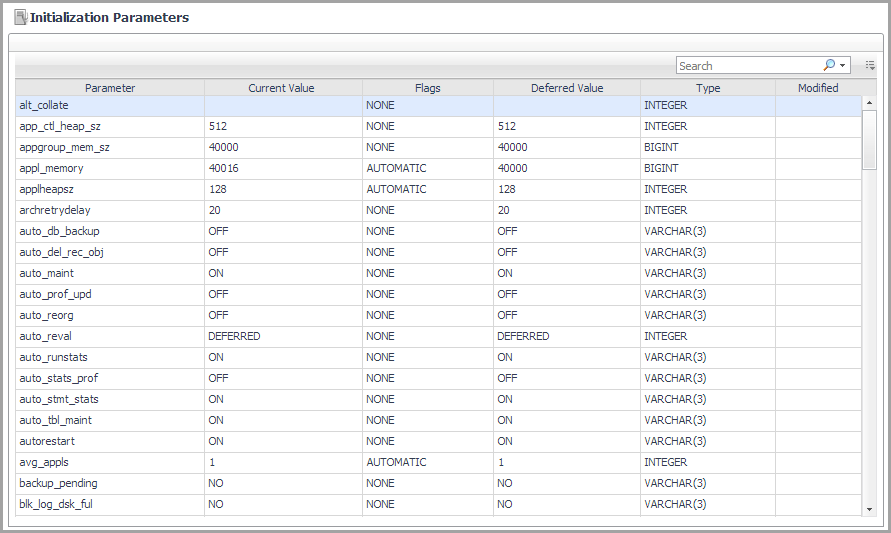
The Configuration drill-down provides the list of initialization parameters with their current values and other pertinent information, sorted in alphabetical order.

On the Database home page toolbar, click Configuration.

This pane provides the Initialization Parameters view.

Displays the list of initialization parameters with their current values and other pertinent information, sorted in alphabetical order.

Parameter. The initialization parameter name.
Current Value. The current value of the initialization parameter.
Flags. Whether the initialization parameter is flagged as AUTOMATIC.
Deferred Value. The deferred value of the initialization parameter. If a non-AUTOMATIC parameter was changed and the database has not yet been recycled, the deferred value may be different than the current value.
Type. The type of value for the initialization parameter.
Modified. Whether the initialization parameter has been modified.

Clicking any table cell displays the change history for the corresponding initialization parameter.

Member Overview home page

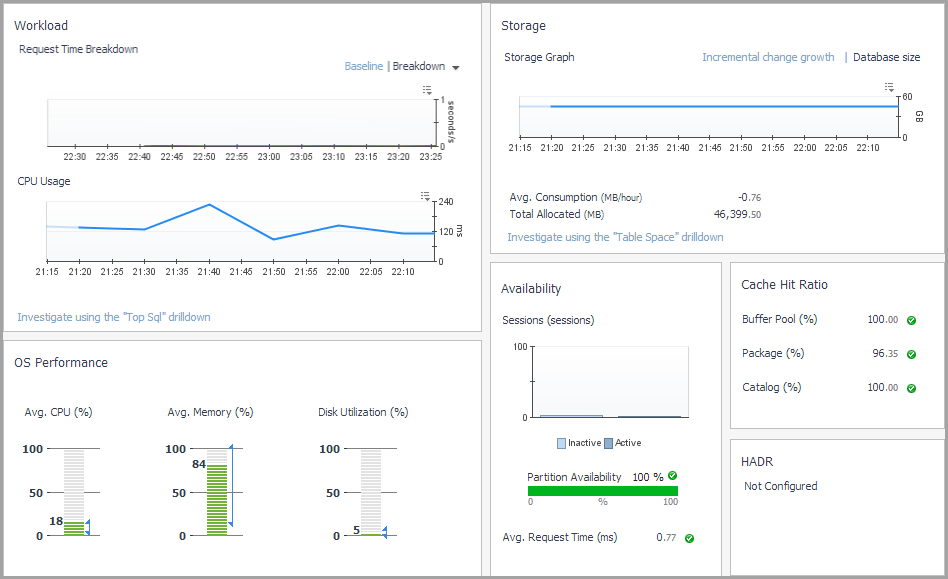
This home page provides metrics on the state of the member over the course of the selected time range. Pop-ups provide graphs that show you how the member is performing and whether there are any critical areas that need to be addressed.

The metrics provided on this home page are different for DB2 v9.7.0.1 and later than they are for DB2 databases earlier than v9.7.0.1. For more information, see below sections.

How to Get Here

1
From the Database home page, click Whole Database and select the member you want.
2
Click Summary and select Overview.

The following summary and drill-downs pages are provided:

SQL Performance (links to description under Database home page)
Activity Drill-downs (links to description under Database home page)
Memory Drill-downs (links to description under Database home page)
Storage Drill-downs (links to description under Database home page)
Log Drill-down (links to description under Database home page)
Configuration Drill-down (links to description under Database home page)
Documentos relacionados

The document was helpful.

Selecione a classificação

I easily found the information I needed.

Selecione a classificação