
Configuring monitoring agents for data collection
VMware Monitoring in Foglight® for Storage Management uses the VMware Performance Agent to collect information from monitored environments. Creating a VMware Performance Agent instance creates the agent process on the Agent Manager host. Activating the VMware Performance Agent starts that agent process while starting an agent instance’s data collection enables the agent to start collecting data from the monitored vCenter® and to send it to VMware Monitoring in Foglight for Storage Management.
When the VMware Performance Agent package is successfully deployed, create one or more agent instances, activate them, and start their data collection. To perform these steps in a single operation for one or more monitored hosts, use the Agents view on the Administration tab.
Each VMware Performance Agent monitors a single Virtual Center. When you create a VMware Performance Agent instance and the Agent Setup wizard determines that the Virtual Center was not previously monitored by this Foglight for Storage Management instance, it starts importing historical data into Foglight for Storage Management. This data is not immediately available as it takes some time to collect it. This process can import data collected over 30 days or less, depending on the amount of data available in the Virtual Center. This allows you to explore VMware metrics as soon as the data is imported, instead for waiting for the agent to collect some data from the Virtual Center. The Metric History column in the Agents table indicates the progress of the historical data import. Historical data is intended for charting, trending, and general presentation purposes. It does not cause any alarms to fire.
|
2 |

|
a |
In the Virtual Center box, type the fully qualified name of the host on which the Virtual Center is running. |
|
b |
In the Port box, type the port number of the host running the Virtual Center that will be used by the VMware Performance Agent to connect to the Virtual Center. |
|
c |
If you want to enable the VMware Performance Agent to collect the Foglight for Storage Management Storage data, select the Enable Storage Collection check box. Foglight for Storage Management Storage can help you optimize the VMware environment by monitoring virtual storage and its underlying physical storage components. For more information about this product, see the Managing Foglight Manager Storage User and Reference Guide. |
|
d |
If you want to import historical data, select the Enable Historical Metric Data check box. This data is not immediately available as it takes some time to collect it. This process can import data collected over 30 days or less, depending on the amount of data available in the Virtual Center. Selecting this option allows you to explore VMware metrics as soon as the data is imported, instead for waiting for the agent to collect some data from the Virtual Center. |
|
e |
Click Next. |
|
• |
Add vCenter(s) to a new credential: Select this option if you want to create a new credential for the selected vCenter. Click Next and continue to Step 6. |
|
• |
Add vCenter(s) to an existing credential: Select this option if you want to use an existing credential for the selected vCenter. This option is suitable if an existing credential has the information needed to access the vCenter. Click Next and continue to Step 7. |
|
• |
Credential Name: Type a name that uniquely identifies the credential. |
|
• |
User: Type the vCenter user name. |
|
• |
Password: Type the vCenter password. |
|
• |
Confirm Password: Type the vCenter password. |
|
c |
Click Next. |
|
d |
Click Finish. |
|
b |
Click Next. |
|
c |
Click Finish. |
Investigating performance metrics
|
NOTE: The VMware Explorer dashboard is inventory-based. The VMware Explorer dashboard counts all virtual machines (VMs), including template VMs, for each vCenter. The Virtual Environment Summary dashboard is service-based. The VMware service created by VMware Monitoring in Foglight® for Storage Management for a particular vCenter does not contain template VMs. Therefore, the number of VMs for a particular vCenter is different when you view it through the VMware Explorer dashboard than the number that appears when you view it through the Virtual Environment Summary dashboard. |
To access this dashboard, from the navigation panel, under Dashboards, click VMware > VMware Explorer. For complete reference about the data appearing on this dashboard, see VMware Explorer views .
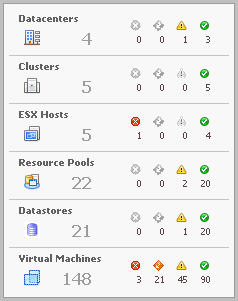
The Virtual Infrastructure view contains a navigation tree on the Topology tab that represents the various virtual infrastructure objects: Virtual Centers, Datacenters, Clusters, ESX Hosts, Resource Pools, and Virtual Machines. For each individual object or group of objects, a status indicator appears, showing the alarm of highest severity that is outstanding for the that object or objects. For example, there are 25 virtual machines configured for a vCenter. Twenty of the virtual machines have a normal status, three have a warning status, and two have a critical status. In the Topology view, the virtual machines container for that vCenter displays a critical status indicator to show that at least one of the virtual machines associated with the vCenter has an outstanding critical alarm.
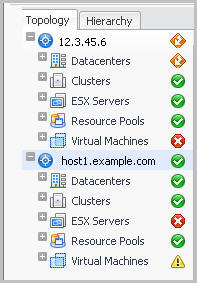
The Hierarchy tab shows the logical layout of vCenter management servers.
Hovering over an object in the Virtual Infrastructure view, you see a popup that provides a summary of the present state of that object.
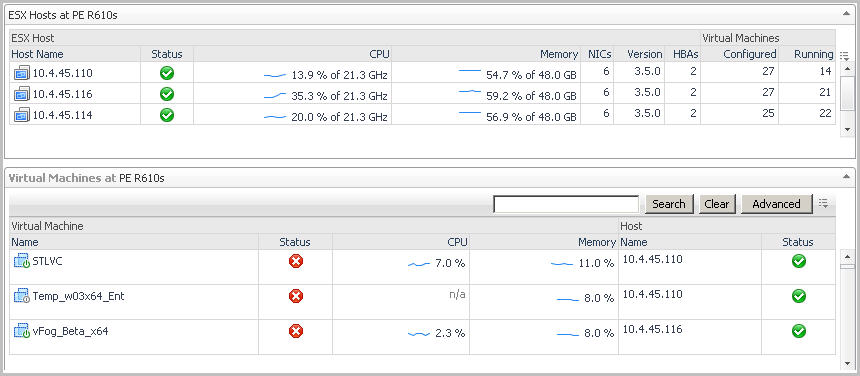
Selecting an object or group of objects on either tab of the Virtual Infrastructure view displays performance details about your selection in the VMware Explorer Primary view. The VMware Explorer Primary view takes up the entire display area of the VMware Monitoring in Foglight for Storage Management browser interface. This view provides significant value to administrators who leverage VMware Monitoring in Foglight for Storage Management to monitor their virtual infrastructure.
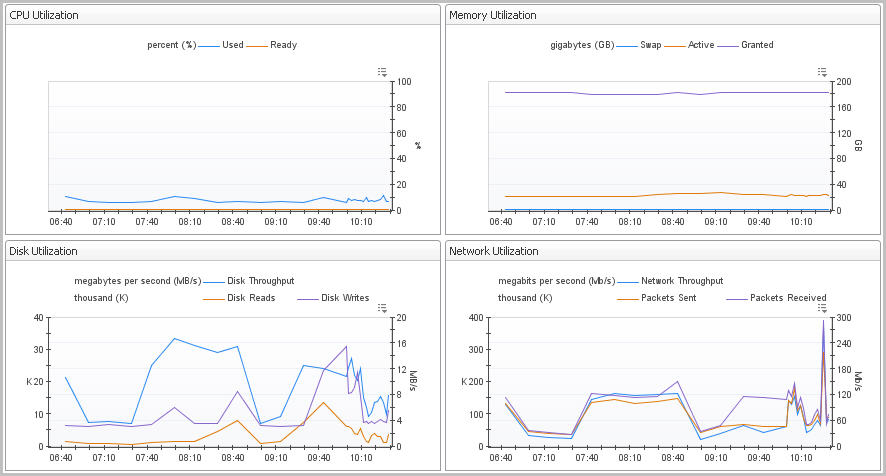
The Utilizations view, typically located across the center of the display area tab, provides numerical and graphical representations of utilization metrics associated with the selected object or group of objects. For example, selecting a single resource pool from the Virtual Infrastructure view and opening the Performance tab in the display area, displays four graphs in the Utilizations view, showing CPU, memory, disk, and network resource utilizations for the selected resource pool.
If you open the VMs tab for that same resource pool, the Utilizations view displays one graph illustrating the percent-used and percent-ready CPU utilization for the virtual machines of the resource pool.
If, however, you select a collection of ESX Hosts from the Virtual Infrastructure view and you open the Summary tab, an informative graph appears in place of a Utilizations view. Selecting a collection of objects in the Virtual Infrastructure view always shows a composite view displaying information about all object instances contained in that collection.
In addition to the Utilizations view, one or more Related Objects views may appear at the bottom of the display area. These views take the form of tables and list either the parent or child objects or both (whichever are applicable) of the object being viewed, and provide pertinent details about each one. Their appearance depends on the type and range of objects selected in the Virtual Infrastructure view.
However, when you select a cluster container, the Summary tab shows a Related Objects view that lists all of the clusters in that container and provides pertinent details about each one.
Viewing baseline ranges
Start creating a custom dashboard by clicking Create dashboard on the action panel. From there, create a view and add one or more of the data elements listed above. For complete information about custom dashboards and how to get started, refer to the Foglight for Storage Management User Help and the Creating Custom Dashboards learning video.
Before finishing, edit the view properties and enable the appearance of the baseline minimum and maximum values by selecting one or more of the Show baseline min/max as check boxes.
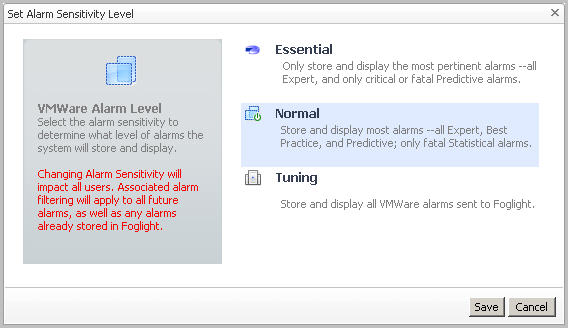
Setting the alarm sensitivity level
The VMware Agent Administration dashboard enables you to configure the level of alarm sensitivity. The VMware Monitoring in Foglight® for Storage Management alarm sensitivity reflects the level of alarms the system stores and displays.
|
1 |
On the VMware Agent Administration dashboard click Set Alarm Sensitivity Level. |
|
3 |
Click Save. |