지금 지원 담당자와 채팅
지원 담당자와 채팅

Foglight for VMware 5.7.0 - User and Reference Guide

Using Foglight for VMware
Introducing the virtual infrastructure Navigation basics Interacting with Foglight for VMware VMware Performance Agent configuration
Reference
Views
VMware Alarms views VMware Explorer views VMware Modeler views VMware VirtualCenter views VMware Environment views Other views
Rules
Agent Rules Cluster Rules Datacenter Rules Datastore Rules Resource Pool Rules ESX Server Rules VirtualCenter Rules Virtual Machine Rules VMW Stale Data Management Rule Virtual Switch Rules
Appendix: Alarm Messages

ESX Host Summary view

The ESX Host Summary view shows the overall resource utilization and the amounts of system resource consumption for a physical ESX host.
1
On the VMware Environment dashboard, on the Monitoring tab, in the Virtual Environment Overview, select the ESX Hosts tile.
2
In the Quick-View, select a ESX host node in the ESX Hosts view.
The ESX Host Summary view appears on the right.
Table 142. Alarms
Alarm Message. An explanation about why the alarm occurred.
Severity. Indicates the alarm severity: Warning, Critical, or Fatal.
Time. The time when the alarm was generated.
Alarm Message, Severity, or Time. Displays the Alarm dialog box, showing additional information about the alarm. For more information about alarms in Foglight, see the Foglight User Help.
Figure 294. Alarm dialog box
Table 143. Related Items
Datacenter. The name of the datacenter associated with the selected ESX host.
Datastores. The number of datastores that are associated with the selected ESX host, followed by the related alarm counts.
ESX Hosts. The name of the selected host, followed by the related alarm counts.
Resource Pools. The number of resource pools that are associated with the selected ESX host, followed by the related alarm counts.
Virtual Center. The name of the virtual center associated with the selected ESX host, followed by the related alarm counts.
Virtual Machines. The number of virtual machines that are associated with the selected ESX host, followed by the related alarm counts.
Alarm count. Displays the Alarms dialog box that shows a list of all related alarms. For each alarm entry, it shows its severity, the time at which it was triggered, the rule name that triggered the alarm, and the alarm message.
Figure 295. Alarms dialog box
Datacenter. Displays the Datacenters Inventory dwell, showing the name and state of the datacenter associated with the selected ESX host.
Figure 296. Datacenters Inventory dwell
Datastores. Displays the Datastores Inventory dwell, showing the names and states of all datastores that are associated with the selected ESX host.
Figure 297. Datastores Inventory dwell
ESX Host. Displays the ESX Hosts Inventory dwell, showing the name and state of the selected ESX host.
Figure 298. ESX Hosts Inventory dwell
Resource Pools. Displays the Resource Pools Inventory dwell, showing the names and states of all resource pools that are associated with the selected ESX host.
Figure 299. Resource Pools Inventory dwell
Virtual Center. Displays the Virtual Centers Inventory dwell, showing the name and state of the virtual center associated with the selected ESX host.
Figure 300. Virtual Centers Inventory dwell
Virtual Machines. Displays the Virtual Machines Inventory dwell, showing the names and states of all virtual machines that are associated with the selected ESX host.
Figure 301. Virtual Machines Inventory dwell
CPU Load. The current percentage of the selected ESX host’s CPU load, used to execute system code and user programs, based on the total CPU capacity.
CPU Utilization, Baseline. An envelope indicating the expected CPU utilization range based on historical data.
CPU Utilization, % Ready. The percentage of the ESX host’s CPU resources that is ready to execute system code and user programs during the selected time period.
CPU Utilization, % Used. The percentage of the CPU utilization used by ESX hosts to execute system code and user programs, during the selected time period.
Datastore I/O. The current datastore I/O rate for the selected ESX host.
Datastore Utilization, Baseline. An envelope indicating the expected datastore utilization range based on historical data.
Datastore Utilization, Transfer Rate. The rate at which data was read from and written to the datastore of the selected ESX host during the specified time period.
Memory Utilization, Baseline. An envelope indicating the expected memory utilization range based on historical data.
Memory Utilization, Utilization. The current percentage of the average memory usage by the selected ESX host, based on the total memory capacity.
Network I/O. The current rate at which the selected ESX host transfers data from and to the network.
Network Utilization, Baseline. An envelope indicating the expected network utilization range based on historical data.
Network Utilization, Transfer Rate. The rate at which the selected ESX host transfers data to and from the network during the selected time period.
CPU Load spinner. Displays the CPU Load dialog box.
Figure 302. CPU Load dialog box
CPU Utilization graph. Displays the CPU Utilization dialog box.
Figure 303. CPU Utilization dialog box
Disk I/O spinner. Displays the Disk I/O dialog box.
Figure 304. Disk I/O dialog box
Disk Utilization graph. Displays the Disk Utilization dialog box.
Figure 305. Disk Utilization dialog box
Memory Utilization graph. Displays the Memory Utilization dialog box.
Figure 306. Memory Utilization dialog box
Network I/O spinner. Displays the Network I/O dialog box.
Figure 307. Network I/O dialog box
Network Utilization graph. Displays the Network Utilization dialog box.
Figure 308. Network Utilization dialog box

Summary - All ESX Hosts view

The Summary - All ESX Hosts view displays overall resource utilization information for a group of physical ESX hosts and shows the elements that consume the highest amount of system resources.
1
On the VMware Environment dashboard, on the Monitoring tab, in the Virtual Environment Overview, select the ESX Hosts tile.
2
In the Quick-View, select the Summary node in the ESX Hosts view.
The Summary - All ESX Hosts view appears on the right.
Table 145. Alarms
Alarm Message. An explanation about why the alarm occurred.
Severity. Indicates the alarm severity: Warning, Critical, or Fatal.
Time. The time at which the alarm was generated.
Severity. Displays the Alarm Created dialog box, showing additional information about the alarm. For more information about alarms in Foglight, see the Foglight User Help.
Figure 310. Alarm Created dialog box
ESX Host. The name of the ESX host.
Used Hz.The amount of CPU processing speed each of the top three CPU consumers spend on executing system code and user programs, during the selected time range.
Used Hz (in the graph). Displays the Top 3 ESX Hosts-CPU Used Hz dialog box.
Figure 311. Top 3 ESX Hosts-CPU Used Hz dialog box
Rate. The rate at which the top three disk consumers read or write data to the disk during the selected time range.
ESX Host. The name of the ESX host.
Rate (in the graph). Displays the Top 3 ESX Hosts - Disk Transfer Rate dialog box.
Consumed. The amount of memory the top three memory consumers use during the selected time range.
ESX Host. The name of the ESX host that is one of the top three memory consumers.
Consumed. Displays the Top 3 ESX Hosts - Memory Consumed dialog box.
Rate. The rate at which the top three network consumers transfer data to or from the network during the selected time range.
ESX Host. The name of the ESX host that is one of the top three network consumers.
Rate. Displays the Top 3 ESX Hosts - Network Transfer Rate dialog box.

ESX Hosts view

This tree view lists the ESX hosts that exist in your environment and shows their state.
Figure 315. ESX Hosts view
Selecting the All ESX Hosts node displays overall resource utilization for all ESX hosts in your integrated system, and the elements that consume the highest amount of system resources in the Summary - All ESX Hosts view on the right. Similarly, selecting a ESX host node shows ESX host-specific metrics in the ESX Host Summary view on the right.
On the VMware Environment dashboard, on the Monitoring tab, in the Quick-View, select the ESX Hosts tile.
The ESX Hosts view appears in the Quick-View on the left.
Alarm severity. The state of the most recent alarm raised against the associated ESX host.
All ESX Hosts. A parent node for the ESX host object instances that appear in this view.
ESX Host. The ESX host name.

FAQts tab

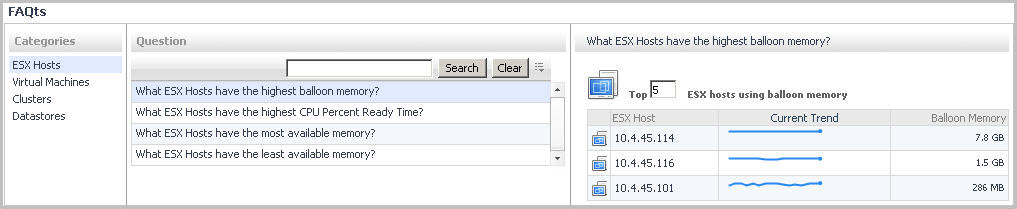
Through three embedded views (the Categories, Question, and Answer views), the FAQts tab enables you to ask Foglight for VMware questions and provides the answers to those questions.
Figure 316. FAQts tab
The FAQts view appears on both the Virtual Environment Summary and VMware Explorer dashboards as a navigation tab.
This view provides an answer to the question selected in the Questions view. The answer appears in the following form:
Top x <objects of category>…
where x is the number of objects of the category you provided in the Categories view.
Specify x by entering a number. The answer is relative to the subset of the infrastructure you are viewing in the dashboard. For example, the top 5 datastores are different for each individual cluster in the infrastructure.
This view lists the questions, for the category selected in the Categories, that can be answered for you by Foglight for VMware.
관련 문서

The document was helpful.

평가 결과 선택

I easily found the information I needed.

평가 결과 선택