지금 지원 담당자와 채팅
지원 담당자와 채팅

Foglight for OpenStack 5.7.4 - User Guide

Using Foglight for OpenStack Interacting with Foglight for OpenStack dashboards Reference

OpenStack Explorer reports

There are several predefined report templates included with Foglight for OpenStack. When you choose an object type or particular object instance in the Topology view, the Reports button on the top-right of the Foglight browser is populated with predefined reports. Run the reports to record data for analysis and sharing outside of Foglight.

The reports available when clicking the Reports button varies by resource object chosen. For a list of available predefined OpenStack report templates, see Available report templates .

Using the OpenStack Alarms dashboard

The OpenStack Alarms dashboard shows the alarms that have been triggered but not cleared. This dashboard can be used to isolate a specific alarm.

3
On the navigation panel, under Dashboards, choose OpenStack > OpenStack Alarms.

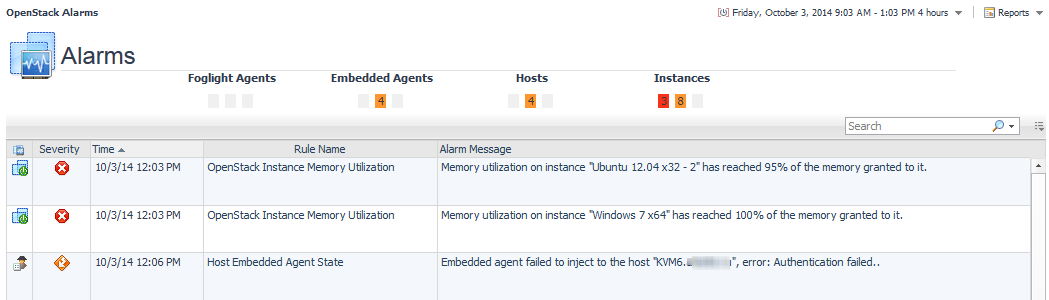
The OpenStack Alarms dashboard provides some filtering controls. Use the OpenStack Alarms dashboard to isolate alarms related to a specific bottleneck or issue in your OpenStack environment. The Search box appears in the top-right corner of the alarm list.

Type a text string and press ENTER. The list of alarms refreshes, showing only those alarms that match that filter.

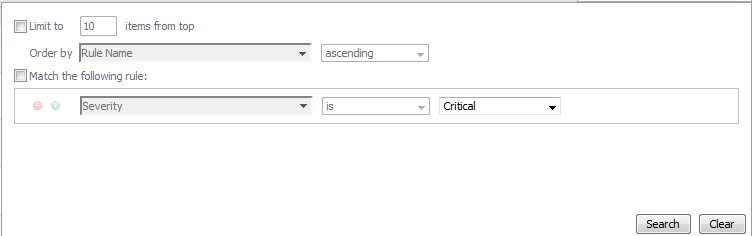
For more advanced filtering, click the down-facing arrow, and in the list that appears, click Advanced Search. A dwell appears.

Figure 25. Advanced Search

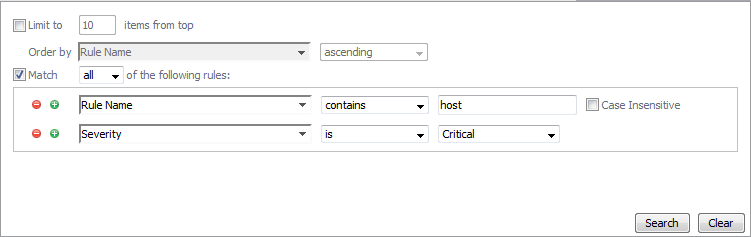
To search on an alarm severity or rule name, or to combine different search criteria, update or add one or more rules in the Match all the following rules area.

Figure 26. Filtering rules

To remove a filter, click Clear. The list of alarms refreshes, showing all the generated alarms.

Using the OpenStack Dependency dashboard

The OpenStack Dependency dashboard view shows a navigation tree representing a simplified map of your monitored objects and pertinent alarm information. On the right of each object in the Infrastructure and Users views status indicators are displayed. Each status indicator represents the alarm of the highest severity that is generated against the object. For an object type container, the status indicator represents the alarm of highest severity that is outstanding for all objects of that type.

The information appearing in the OpenStack Dependency dashboard is organized into two tabs and a display area in the right frame:

On this tab, your monitored OpenStack environment appears as the root of the navigation tree, with all its Regions, Availability Zones, Host Aggregates, Hosts, Instances, and Volumes. This structure illustrates the hierarchy of monitored objects in your OpenStack infrastructure.

Use this view to quickly locate a desired object using the logical hierarchy within your Openstack infrastructure, and to explore any related dependencies.

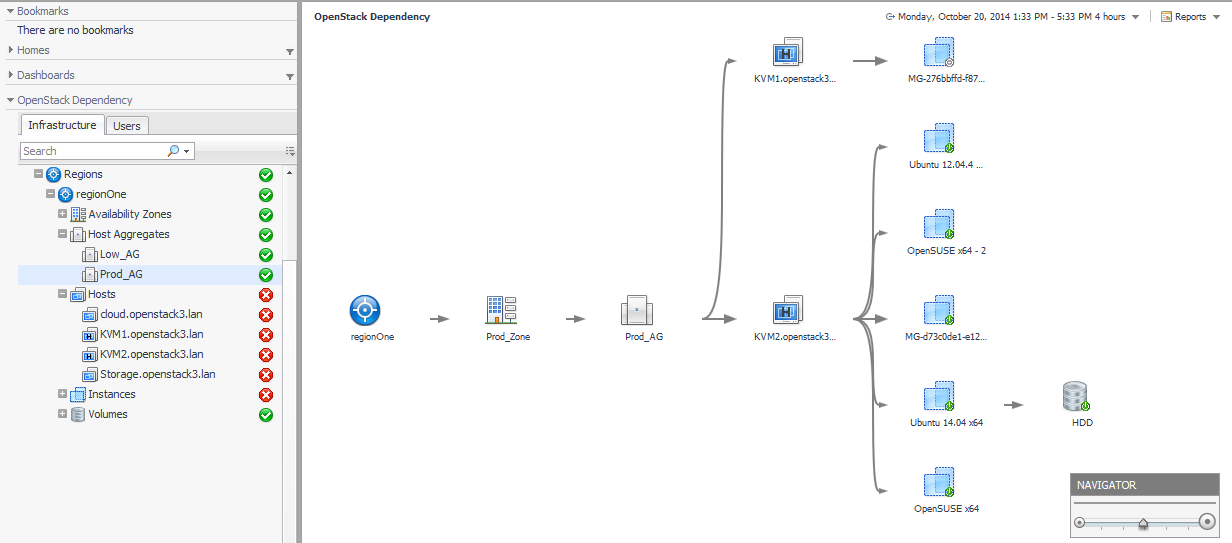
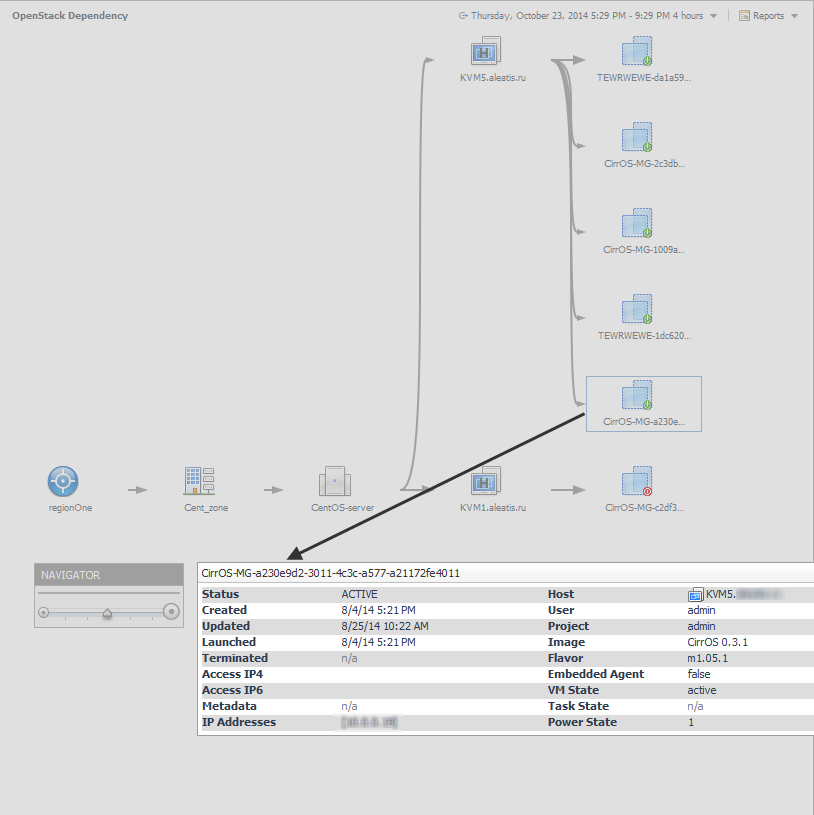
The Infrastructure tab allows you to quickly and easily see which hosts are running a hypervisor and which hosts are not. A host icon without the H identifier is not running a hypervisor. The H indicator in a host icon identifies that host as running a hypervisor.

In the preceding dashboard, KVM1 and KVM2 are computer nodes running a hypervisor. cloud and Storage are controller nodes running scheduling and storage services respectively.

The Users tab focuses on the relationships between containers and users. To open this tab, on the navigation panel, under OpenStack Dependency, click Users.

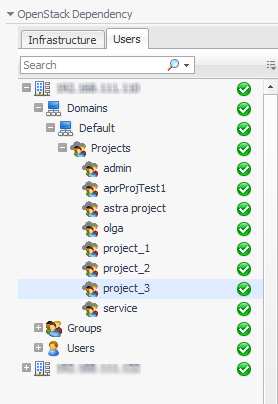
Like the Infrastructure tab, this tab also displays the monitored OpenStack environment as the root of the navigation tree, showing Domains, Projects, Groups, and Users.

Figure 28. Users tab

The OpenStack Dependency dashboard displays a dependency map showing the selected object and any dependencies that it may have with other physical and virtual components in your monitored environment.

Click a Region, Availability Zone, or Host Aggregate object to view summary information. Clicking a Host, Instance, or Volume displays configuration information.

Zoom in or out using the slider on the NAVIGATOR to reduce or enlarge the topological view. The NAVIGATOR can be dragged and positioned anywhere on the topological view.

Reference

Foglight for OpenStack includes the following views:

관련 문서

The document was helpful.

평가 결과 선택

I easily found the information I needed.

평가 결과 선택