Chatta subito con l'assistenza
Chat con il supporto

Foglight for OpenStack 5.6.15 - User Guide

Using Foglight for OpenStack Interacting with Foglight for OpenStack dashboards Reference

Quick View

The Quick View appears in the middle of the Monitoring tab on the OpenStack Environment dashboard. For more information about this dashboard, see Using the OpenStack Environment dashboard .
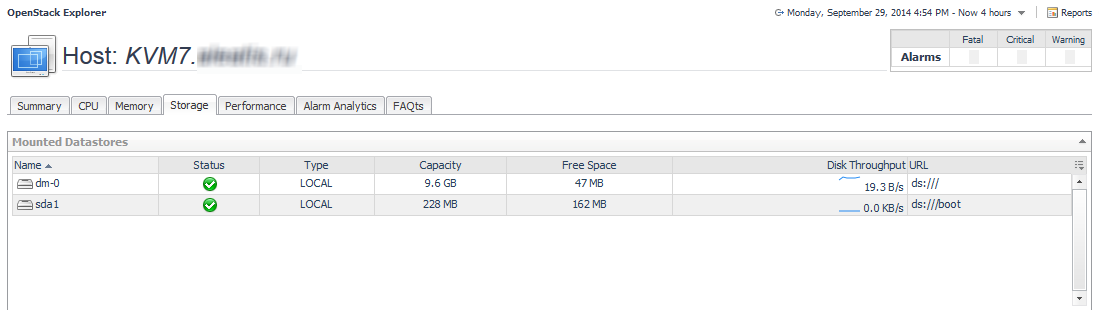
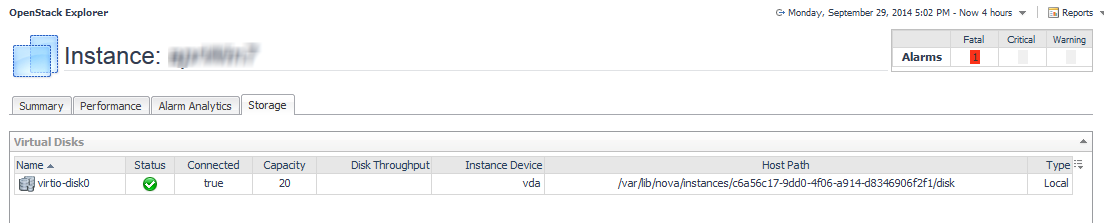
Resource object list view: displays the list of objects associated with the selected resource.
FAQts view: displays the list of questions relevant to the selected resource.
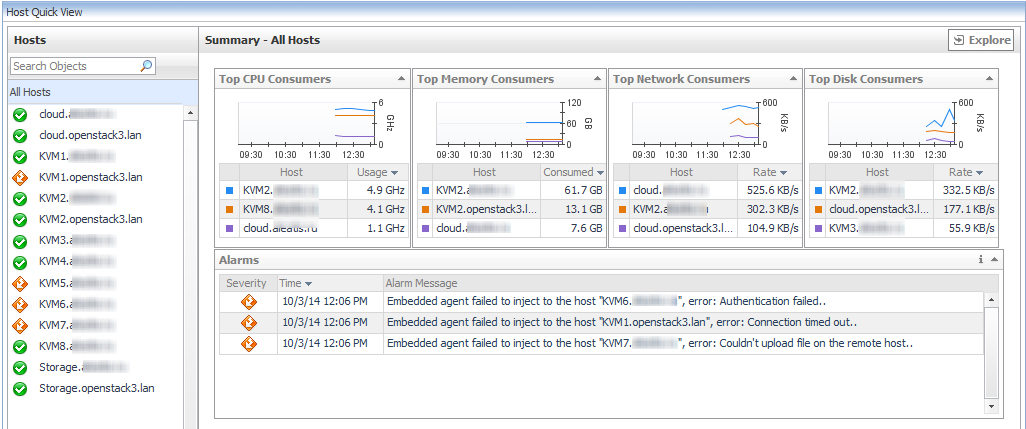
Summary view: displays a summary of relevant information related to the selected resource object or group of objects.
Alarms view: displays a list of alarms and when they were raised.

Reports tab

Figure 53. Reports tab

Resource Utilizations view

For example, selecting a particular Host Aggregate from the Topology tab and opening the Performance tab in the display area, displays four graphs in the Resource Utilizations view. The graphs depict CPU, memory, disk, and network resource utilizations for the selected Host Aggregate.
On the Summary tab, clicking a graph or a spinner shows a larger view of the graph with descriptive text about each metric appearing in the graph.

Storage

The Storage tab displays a list of all mounted datastores on a Host or a list of all virtual disks associated with a particular Instance.
Related Documents

The document was helpful.

Seleziona valutazione

I easily found the information I needed.

Seleziona valutazione