Tchater maintenant avec le support
Tchattez avec un ingénieur du support

NetVault 13.0.2 - Administration Guide for Managed Service Providers

Introduction Getting started Configuring clients Managing catalog search Configuring storage devices
About storage devices SAN considerations Quest DR Series systems Quest QoreStor NetVault SmartDisk EMC Data Domain Systems Snapshot Array Manager Virtual Tape Libraries Virtual standalone drives Shared Virtual Tape Libraries Physical tape devices Storage tiers
Backing up data Managing policies Restoring data Managing NetVault dashboard Managing jobs Monitoring logs Managing storage devices
Role-based access to manage storage devices Monitoring device activity Managing disk-based storage devices in list view Managing disk-based storage devices in tree view Managing the Snapshot Array Manager Managing tape libraries in list view Managing tape libraries in tree view Managing tape drives in list view Managing tape drives in tree view Adding shared devices
Managing storage media Managing user and group accounts Managing Tenant Monitoring events and configuring notifications Reporting in NetVault Working with client clusters Configuring default settings for NetVault
About configuring default settings Configuring encryption settings Configuring plug-in options Configuring default settings for post-scripts Configuring default settings for Verify Plug-in Configuring Deployment Manager Settings Configuring Job Manager settings Configuring Logging Daemon settings Configuring Media Manager settings Configuring Network Manager settings Configuring Process Manager settings Configuring RAS device settings Configuring Schedule Manager settings Configuring Web Service settings Configuring Auditor Daemon settings Configuring firewall settings Configuring general settings Configuring security settings Synchronizing NetVault Time Configuring the reporting utility Configuring NetVault WebUI default settings Configuring NetVault to use a specific VSS provider Configuring default settings using Txtconfig
Diagnostic tracing Managing diagnostic data Using the deviceconfig utility NetVault processes Environment variables Network ports used by NetVault Troubleshooting
Common errors Safe Mode in NetVault

Customizing table views for reports

After a report is generated, you can modify the table views to include or exclude columns, change the column order, and add column totals and other aggregate values. You can add multiple table views for a component. The reporting system lets you save these settings to the job definition so that the custom format is used every time you run the report.

2
In the report window, click the Settings link at the upper-right corner of the table. If the report contains multiple components, click the link associated with the table that you want to modify.
3
In the Table Settings dialog box, the available columns are listed. The columns that have the corresponding Show check box selected are included in the table view. For example, the following Table Settings dialog box is displayed for the report- Data Stored By Client.
Hide columns: To hide one or more columns, clear the check marks for those columns.
Show columns: To show hidden columns, click the corresponding Show check boxes.
Display aggregate values: To add fields that display the total, minimum, maximum, and other aggregate values for the columns, select the field type in the Aggregate list. This list is only displayed for columns that contain numeric values.
Total: Displays the sum of all the values in the column.
Average: Displays the average value of all the values in the column.
Min: Displays the maximum value of all values in the column.
Max: Displays the minimum value of all values in the column.
Count: Displays the count of records.
None: Removes the aggregate field.
Click Apply to apply the settings to the table view and close the dialog box.
6
To add a table, click the Add another view link at the lower-left corner of the component table.
If the component only supports table views, a new table is automatically added. If different view types are supported, then the Add a view dialog box is displayed. To add a table, select Table in the Type of view list.
7
To remove a view, click the Remove this view link at the lower-left corner of the component table.
8
To save the custom settings, click the Save report format link at the upper-left corner of the report.

Adding charts to reports

You can use the graphical capabilities of the reporting system to view the output in the form of bar charts and pie charts. You can use multiple chart views to compare different sets of data. The reporting system lets you save these settings to the job definition so that the custom format is used every time you run the report.

2
In the report window, click the Add another view link at the lower-left corner of the table. If the report contains multiple components, click the link associated with the component for which you want to add a chart.
The Add a view dialog box is displayed if the component supports graphical views.

Bar charts

You can use bar charts to provide a visual comparison of data values.

To add a bar chart, do the following:

In the Type of view list, select Barchart.
In the Category list, select a column to represent the vertical axis. A bar is generated for each record in the category column. The column values are used as labels.
In the Value list, select a column to represent the horizontal axis. The data values determine the length of the bars.

Click OK.

Figure 33 displays a bar chart view.

Pie charts

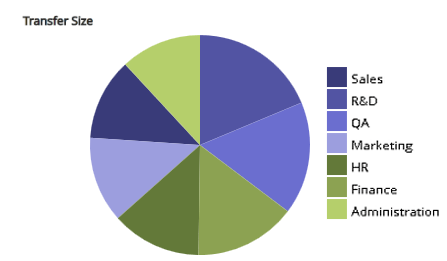
You can use pie charts to show the relative contribution of different categories to the total.

To add a pie chart, do the following:

In the Type of view list, select Piechart.
In the Category list, select a column to represent the categories or parts of the pie. The number of records in the category column determines the number of slices in the chart. The column values are used as legends.
In the Value list, select the column that contains the data for the pie chart. The data values determine the size of the slices.

Click OK.

Figure 34 displays a pie chart view.

4
To remove a view, click the Remove this view link at the lower-left corner of the component table.
5
To save the custom settings, click the Save report format link at the upper-left corner of the report.

This section includes some sample charts generated using the reporting system.

The following figure displays the bar chart view for a sample data set.

Figure 33. Bar chart view

The following figure displays the pie chart view for a sample data set.

Figure 34. Pie chart view

Exporting reports to PDF files

After a report is generated, you can choose to export the report to a PDF file. The file is displayed in a browser window. You can download, save, the file, as required.

2
In the report window click the Export as PDF link at the upper-left corner of the report.

Available reports

NetVault provides the following types of predefined reports listed on View Reports page in alphabetical order.


Data Stored by Client

You can use this report to view the amount of data stored by existing NetVault Clients during a specified period.

By default, the report displays the data for the last 7 days; you can set the report filters to change the period. You can also set the Client Name filter to view the details for specific clients.

The table includes the following details: Start Time, Start Date, Run Length, End Date, End Time, Job ID, Client Name, Transfer Size, Plugin, and set names (Selection Set, Selection Options, Schedule set, Backup Target Set, and Advanced Options Set).

Front Side Data By Tenant

This report shows the amount of source data protected for a Tenant. This report shows how many jobs have been successfully backed up and their collective size over a period of their lifetimes, a day, week, month (28 days), year. You can view the following details: Tenant ID, Tenant Name, Job Count, and Total size.

Historic Jobs — by date

You can use this report to view information about all backup and restore jobs that were performed during the specified period. The records are sorted by start date (newest to oldest).

By default, the report includes the jobs that were run in the last 7 days. You can set the report filters to change the period.

You can view the following details: start time, start date, run length, job title, job ID number, instance, client name, Backup Selection Set name, data transfer size, and job status.

Index Media

This report displays the index media of a backup job.

You can view the following details: Job title, job ID, job instance, job phase, client name, server name, plug-in name, backup time, backup date, media label, off-site location, and Media Online.

Media General

This report provides general information about available tape media items. The table is sorted by media label.

You can view the following details: media label, barcode, media type, format, machine name, media expiry date, offsite location, space used, space left, usable or not, and read-onlyor not.

Tenant Media Quotas and Usage


This report displays the media quota and media usage information for existing NetVault tenants.

The table includes the following details: account name, media quota (in TB), and media used. Media Quota displays the total quota allocated for particular tenant (account) and Media Used displays the used space from the allocated media quota for that tenant (account).

Offline Devices

This report shows which storage devices that are currently offline.

The report includes the following sections:

Offline Devices: The section contains information about tape-based devices that are offline.
Offline RAS Devices: The section contains information about disk-based devices that are offline.

Policies Summary

This report provides information about the policy-based backups performed during the specified period.

By default, the report includes the policies that were run in the last 7 days. You can set the report filters to change the period.

The report includes the following sections:

Total Policy Summary details: This section displays the total count of Policies and Policy jobs.
Policy Basics: This section displays all policy-based backups that were performed during the specified period.

Server Daily Summary

You can use this report to view the daily backup summary for the server. The report also includes information about media items residing in the existing libraries.

The report includes the following components:

Media: The report also provides information about the tapes residing in the specified libraries.

Server License — Capabilities and Usage

This report displays the license capabilities and usage details for clients, SmartClients, and various types of devices. The report also includes the license flag information for various components.

Single Job Summary

This report provides information about a single job. The report includes job information, drive events, data transfer data, and media usage information.

You can set the report filters to view information pertaining to one or multiple instances of the specified job.

The report includes the following sections:

Single Job Main Summary: This section provides the job details for the specified job.
Documents connexes

The document was helpful.

Sélectionner une évaluation

I easily found the information I needed.

Sélectionner une évaluation