Linking to SharePoint Pages and Other ControlPoint Analyses from Analysis Results
When run interactively*, from the results of most ControlPoint analyses, you can:
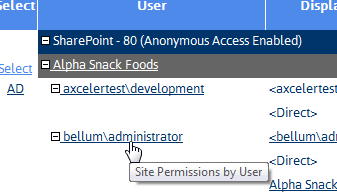
·open relevant SharePoint pages
·generate applicable ControlPoint analyses for the same scope and parameters.
Links to SharePoint pages always open in a separate browser window or tab.
Links to ControlPoint analyses may either open in a separate browser window/tab or in the current workspace, depending on the value of the Open drill-downs in new window .
* Generally, these links are not functional in analysis results that have been exported, although in some cases they may be.
Acting on Search or Data Analysis Results
From ControlPoint search or data analysis results, you can open a SharePoint page or initiate a ControlPoint action or another analysis for selected objects.
This feature can facilitate the performance of a variety of administrative tasks. For example, you can generate a Site Permissions analysis to identify the users who have been granted permissions directly, then initiate the appropriate action (such as Add User to SharePoint Group).
To select objects on which to perform a ControlPoint action or analysis:
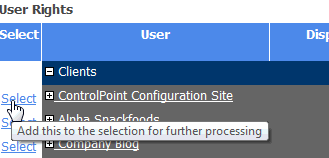
1Click the Select link for the object on which you want to act.
NOTE: To select all objects in the results list, click the Select All link in the Results header.
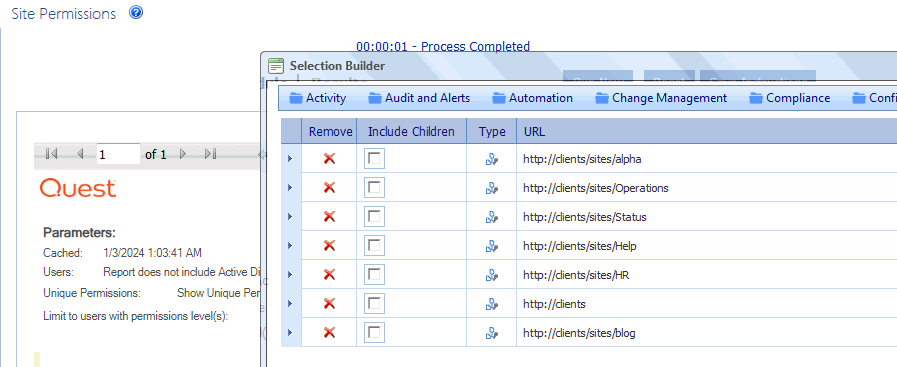
The Selection Builder opens in a separate window.
NOTE: If you want the Selection Builder to remain open in a static location in the browser window, click the Pin On icon (

2If you want to select additional objects, either:
§click the Select All link in the analysis results Select column for each additional item you want to add to the Selection Builder.
OR
§from within the Selection Builder, use the procedure for Changing Your Selection.
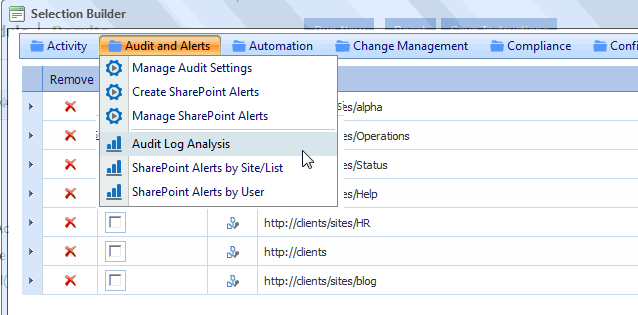
3Choose the applicable SharePoint page or ControlPoint operation from the Selection Builder menu.
§Note that the rules for selecting objects from the left navigation pane apply here as well. For example, only options that are appropriate for the selected object(s) are available.
NOTE: The Selection Builder will appear minimized until you click Restore (
Generating a SharePoint Summary Report
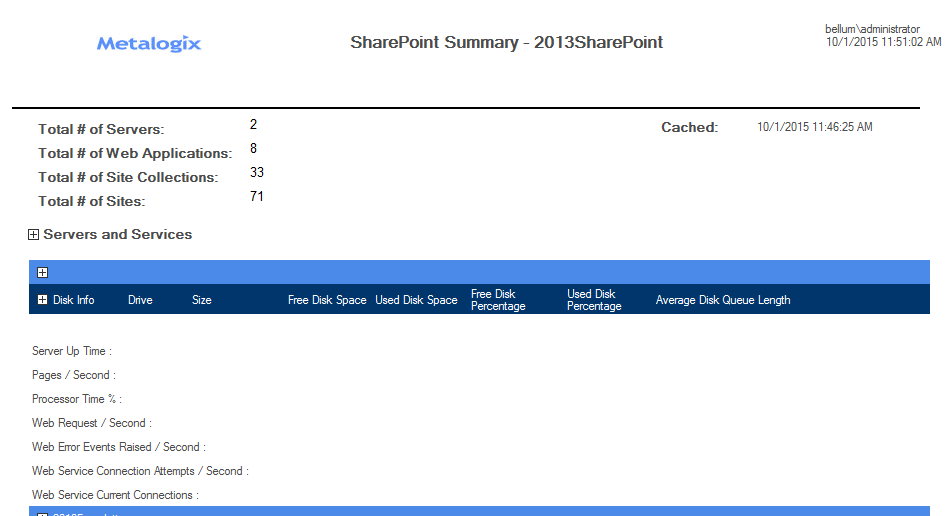
The SharePoint Summary report provides a comprehensive summary of the components (servers, services, Web applications, site collections, and sites) in the SharePoint farm currently being managed in ControlPoint, along with size and usage statistics.
You also have the option of including details about servers in your SharePoint farmsuch as storage, performance, and usage statisticswhich is collected from Windows Performance Monitor. This option can, however, significantly increase the time it takes to generate the report.
NOTE: For a server's details be included in report results, the ControlPoint Service account must have permissions to request status information from the server. Details can be found in the ControlPoint Administration Guide.
To generate a SharePoint Summary report:
1In the SharePoint Hierarchy, select the farm node, the choose SharePoint Summary.
2If different from the default values, specify the following parameters for your analysis:

§Select a View Activity for date or time period from the drop-down.
§If you want to Show Servers Details, check this box.
§If you do not want to Display expanded results, uncheck the box.
Now you can:
·run the operation immediately (by clicking the [Run Now] button)
OR
·schedule the operation to run at a later time or on a recurring basis.
OR
·save the operation as XML Instructions that can be run at a later time.
The SharePoint Summary consists of the following sections:
·a summary of farm components
·Servers and Services
·Web Applications
Farm Components Summary
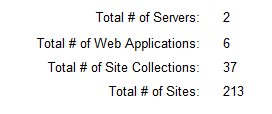
The top of the report displays the total number of servers, Web applications, site collections, and sites in the farm.
Note that the Total # of Sites includes root sites (whereas in the SharePoint Hierarchy, the number that displays in parentheses beside a site collection excludes the root site).
Servers and Services
If you chose to Show Servers Details, the Servers and Services section lists all of the servers in the farm, as well as all of the services currently installed on each server. Storage, performance, and usage details also display.
NOTE: Information reported varies, depending on the nature of the server. For example, Web Requests are not relevant for a SQL server. Depending on how WMI captures the information, if a statistic is irrelevant for the server, the value will display as either N/A or 0.
Web Applications
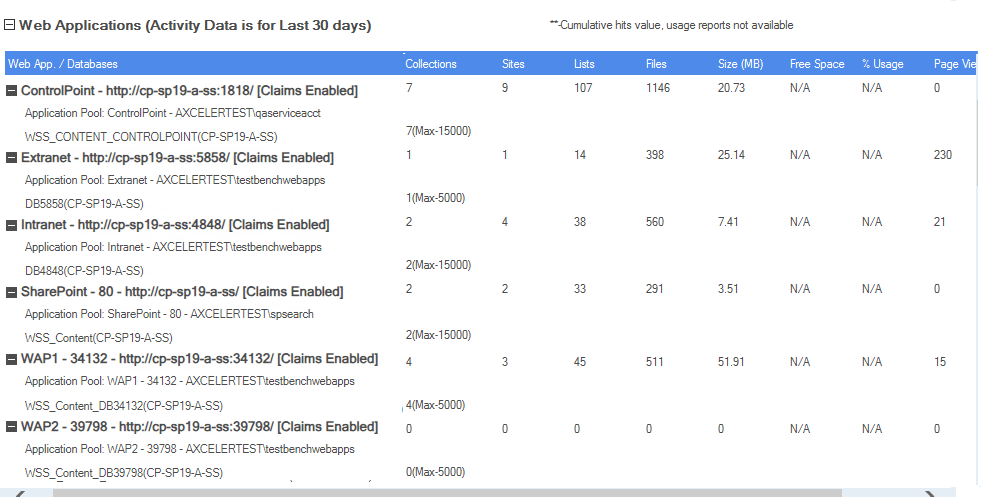
In addition to the Web application name and url, the Web Applications section displays the following statistics for each individual Web application, as well as aggregated totals for the entire farm:
·the number of:
§Site Collections
§Sites - which includes root sites and any subsites that have been created
§Lists - which includes both user-created (visible) lists and internal (hidden) lists, such as galleries, that are necessary for the functioning of the site, and
§Files - which includes web pages as well as documents
·Size, (in MB) - the total size of the Web application's content, which:
§does not include elements such as metadata, logs, free space, and other overhead
§is not the disk size of the content database
·If all site collections within a Web application have quotas:
§Free Space
§% Usage
NOTE: If there are site collections within a Web application that do not have quotas set, "N/A" will display in the Free Space and % Usage columns.
·Number of Requests for the specified date or date range.
When expanded, the following information about each Web application's content database(s) displays:
·the corresponding IIS application pool and the source account that runs the application pool
·the name of both the content database and the server on which it resides
·the current number of site collections in the database, and
·the maximum number of site collections allowed in the database.
Analyzing Activity
ControlPoint offers the following analysis tools that enable you to examine activity within your organization's SharePoint farm for a specific date or time period:
·Most/Least Activity analysis lets you examine site collections, sites, users, lists, and list items that have had the most and/or least activity over a specific time period
·Site Collection Activity Analysis provides detailed activity statistics for one or more site collections.
·Site Activity Analysis provides detailed activity statistics for one or more sites
·Activity by User analysis lets you examine specific pages and documents requested by one or more users.
·Activity by Document analysis lets you examine request detail for each page and document within one or more sites.
·Inactive Users analysis lets you find users who have had no activity for one or more site collections or sites over the past 30 days.
You can also analyze trends in activity over a specified time period. See Analyzing Trends.
IMPORTANT: To generate a fully-functional Activity analysis:
Usage Data Collection must be used by all Web applications in the farm.


