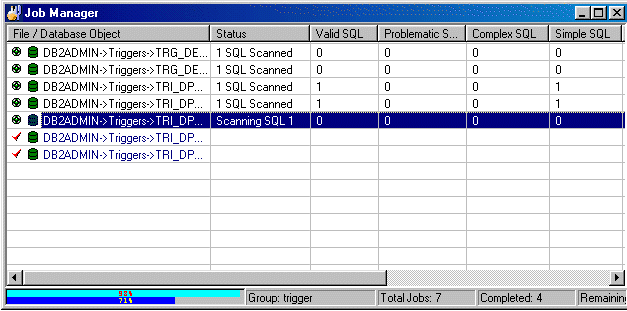
The Job Manager window consists mainly of two components: grid and status bar.
The grid from the Job Manager window stores information on each single Job in the Group.
Displays the job name and associated schema.
|
Icon |
Job Type |
|---|---|
|
|
[Schema name]Object type->Object Name |
|
|
[Schema Name]Event Monitor->Event Monitor Name |
|
|
[Schema name]Text/Binary->Path\File name |
|
|
[Schema name]COBOL->Path\File name |
Displays the current Job status. This column will remain blank until the Job is scanned. It will show the total number of SQL statements found.
Displays the number of valid SQL statements found in the Job. Valid SQL statements are syntactically correct statements recognized by SQL Scanner, and for which DB2 LUW can provide an access plan. Valid SQL statements are further classified as Simple, Complex and Problematic SQL statements.
Displays the number of Problematic SQL statements found.
If the Show Checked SQL figures on the Job Manager window option is selected within Options, you will notice that there are two figures, first one indicates the number of Problematic SQL that have not been checked and the other (enclosed in brackets) is the number of Problematic SQL that have been checked. The total of these two figures represents the total number of Problematic SQL statements.
Displays the number of Complex SQL statements found.
If the Show Checked SQL figures on the Job Manager window option is selected within Options, you will notice that there are two figures, first one indicates the number of Complex SQL that have not been checked and the other (enclosed in brackets) is the number of Complex SQL that have been checked. The total of these two figures represents the total number of Complex SQL statements.
Displays the number of Simple SQL statements found.
If the Show Checked SQL figures on the Job Manager window option is selected within Options, you will notice that there are two figures, first one indicates the number of Simple SQL that have not been checked and the other (enclosed in brackets) is the number of Simple SQL that have been checked. The total of these two figures represents the total number of Simple SQL statements.
Displays the size of the Job in bytes. This cell will show "(n/a)" for Plan Tables and DB2 Event Monitors.
Displays the start date & time of when scanning began.
Displays the total time taken to scan the Job, time is displays in HH24:MM:SS format.
| Item | Description |
|---|---|
| Data Directory | Directory path where all the data files produced during scanning are saved. The data directory path can be changed in the Options window. While scanning, a progress bar will be presented to show scanning progress. The upper bar shows the current Job progress, while the lower bar shows the total Job status. |
| Group |
Name of the currently opened Group. |
| Total Jobs |
Total number of Jobs. |
| Completed |
Total number of Jobs already scanned. |
| Remaining |
Total number of Jobs that have not been scanned. |
In the SQL Scanner, a "group" is used to store "jobs". A Scanner group is a collection of database objects, DB2 Event Monitors, or text and binary files that you selected to group together. A Scanner job is one file or database object. Before you can start to work in the SQL Scanner, you must create a group.
The Group Manager window is used to create, open, delete and rename Groups. It also displays a list of existing Groups. A Group must be opened to display the Job Manager window. Group Manager provides the following functions:
|
Function |
Description |
|---|---|
|
Open |
Opens the selected Group in Job Manager. |
|
Create |
Creates a new Group. |
|
Modify |
Modifies the selected Group name or description. |
|
Delete |
Deletes the selected Group and all associated files. |
Note: All Group information is stored as files in the SQL Scanner data directory defined in the Options window.
To open the SQL Scanner
Click , the first window shown is the Group Manager window. If a Group has not been created before, the Create Group window appears.
After creating a new Group or selecting an existing Group, click the Open. The Job Manager window appears after opening the working Group. If it is an empty group, the Add Jobs wizard also appears.
Quest SQL Optimizer for IBM® DB2® LUW maximizes SQL performance by automating the manual, time-intensive and uncertain process of ensuring that SQL statements are performing as fast as possible. SQL Optimizer analyzes, rewrites, and evaluates SQL statements within multiple database objects, files, or SQL statements captured by the DB2 Event Monitor. With SQL Optimizer, you can analyze and optimize all your problem SQL from multiple sources. SQL Optimizer also provides you a complete index optimization and plan change analysis solution, from index recommendations to simulated index impact analysis, through comparison of multiple SQL access plans.
SQL Optimizer provides you with the following main modules.
SQL Optimizer (including SQL Rewrite and Generate Indexes functions)