|
NOTE: The VMware Explorer dashboard is inventory-based. The VMware Explorer dashboard counts all virtual machines (VMs), including template VMs, for each vCenter. The Virtual Environment Summary dashboard is service-based. The VMware service created by VMware Monitoring in Foglight® Evolve Cloud for a particular vCenter does not contain template VMs. Therefore, the number of VMs for a particular vCenter is different when you view it through the VMware Explorer dashboard than the number that appears when you view it through the Virtual Environment Summary dashboard. |
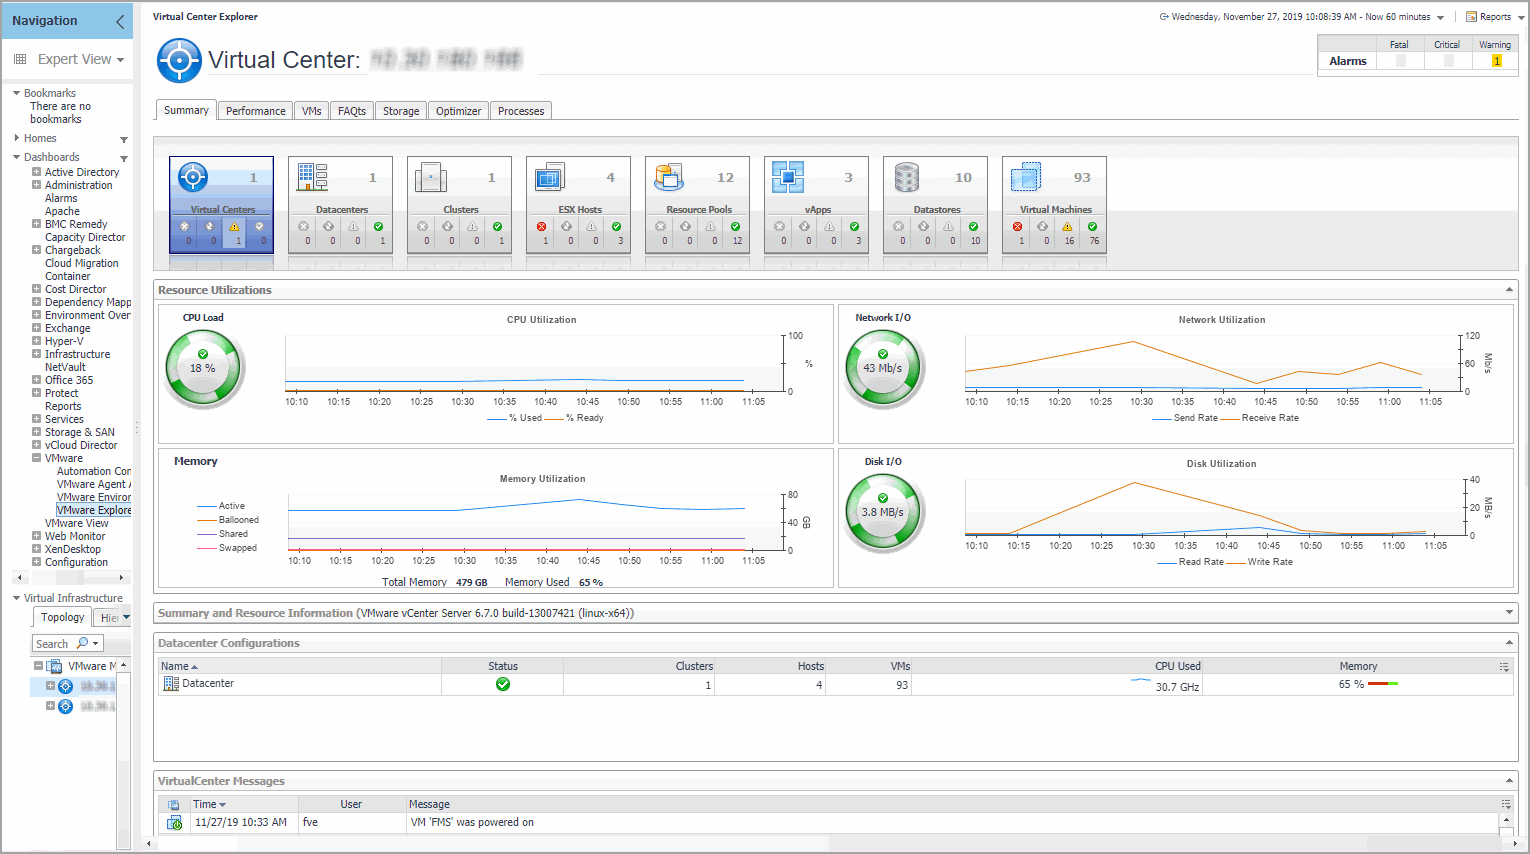
To access this dashboard, from the navigation panel, under Dashboards, click VMware > VMware Explorer. For complete reference about the data appearing on this dashboard, see VMware Explorer views .
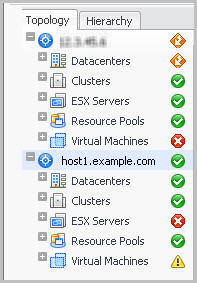
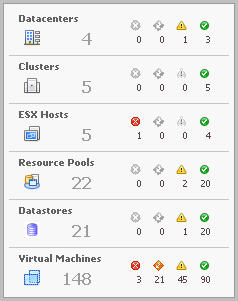
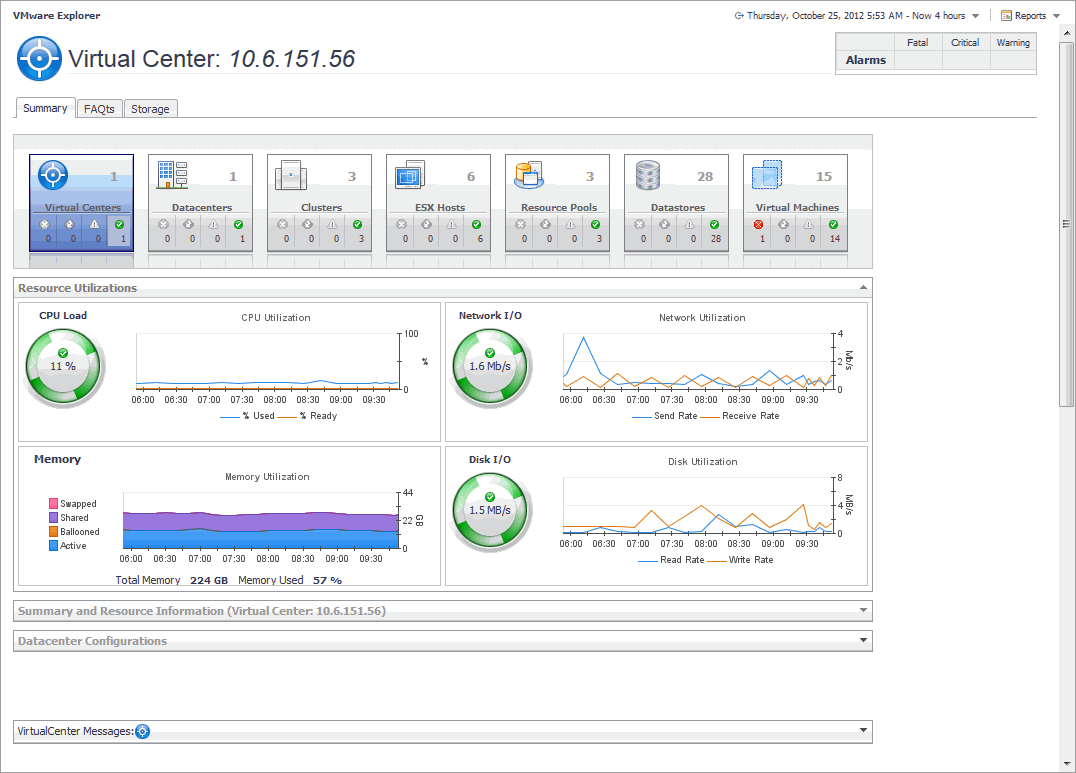
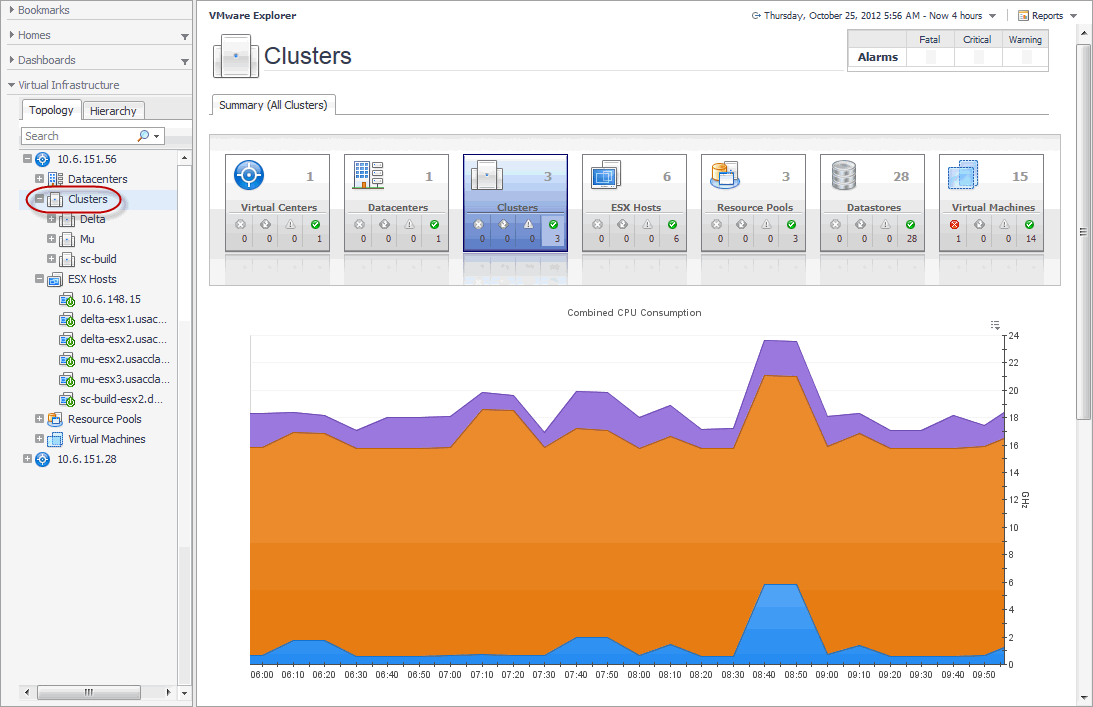
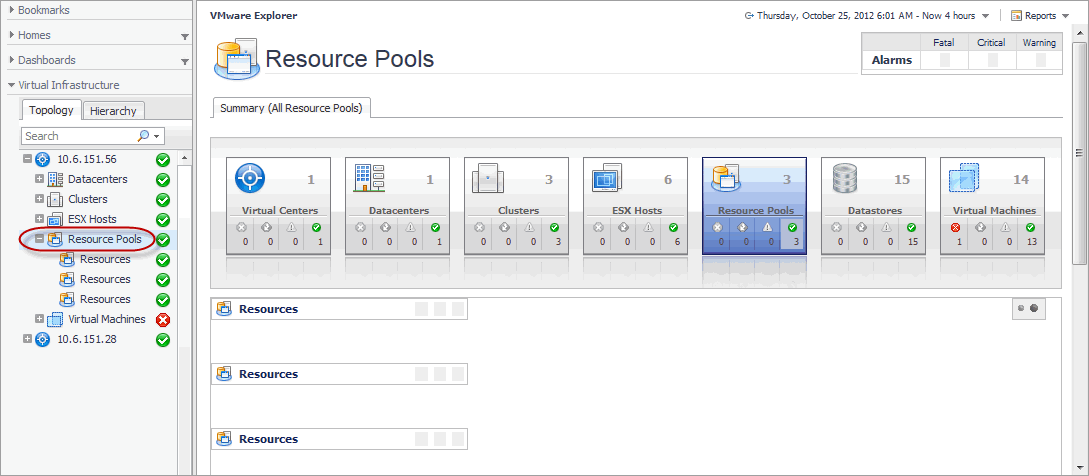
The Virtual Infrastructure view contains a navigation tree on the Topology tab that represents the various virtual infrastructure objects: Virtual Centers, Datacenters, Clusters, ESX Hosts, Resource Pools, and Virtual Machines. For each individual object or group of objects, a status indicator appears, showing the alarm of highest severity that is outstanding for the that object or objects. For example, there are 25 virtual machines configured for a vCenter. Twenty of the virtual machines have a normal status, three have a warning status, and two have a critical status. In the Topology view, the virtual machines container for that vCenter displays a critical status indicator to show that at least one of the virtual machines associated with the vCenter has an outstanding critical alarm.
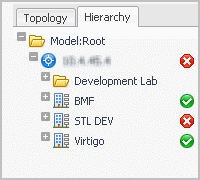
The Hierarchy tab shows the logical layout of vCenter management servers.
Hovering over an object in the Virtual Infrastructure view, you see a popup that provides a summary of the present state of that object.
Selecting an object or group of objects on either tab of the Virtual Infrastructure view displays performance details about your selection in the VMware Explorer Primary view. The VMware Explorer Primary view takes up the entire display area of the VMware Monitoring in Foglight Evolve Cloud browser interface. This view provides significant value to administrators who leverage VMware Monitoring in Foglight Evolve Cloud to monitor their virtual infrastructure.
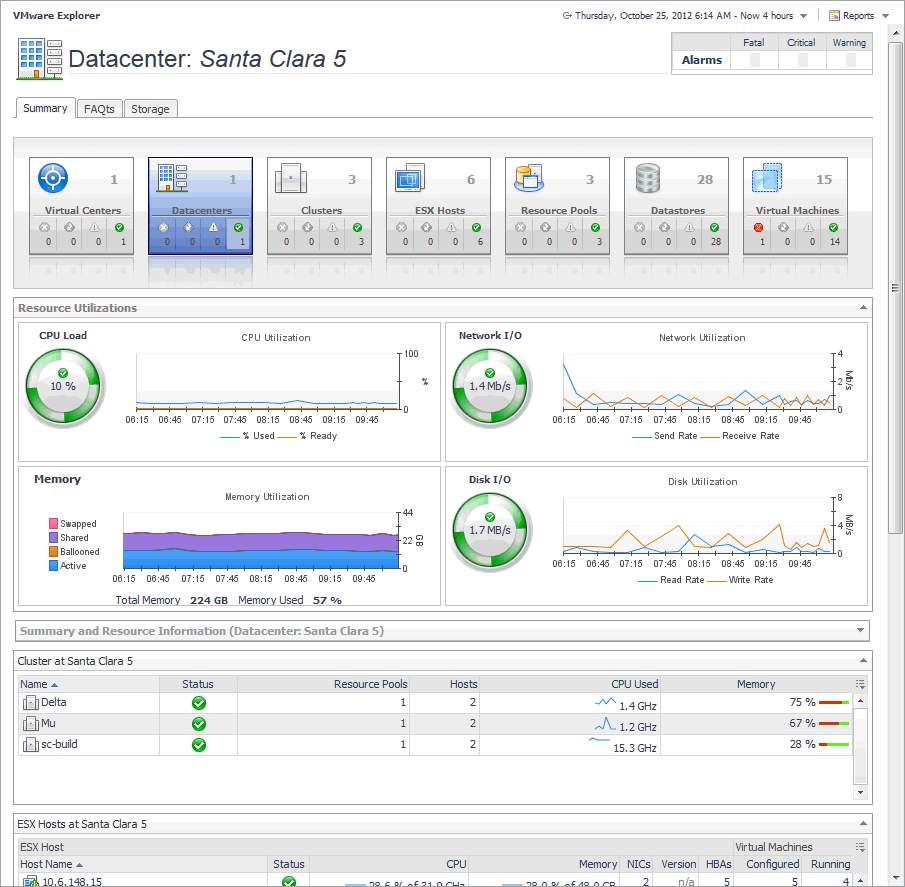
The metrics and the amount of detail displayed in the display area vary depending on the type of the selected object. For example, in the image below, the tiles indicate that the selected object is the New Datacenter datacenter, and that it is connected to one vCenter, one cluster, two ESX® Hosts, and so on.
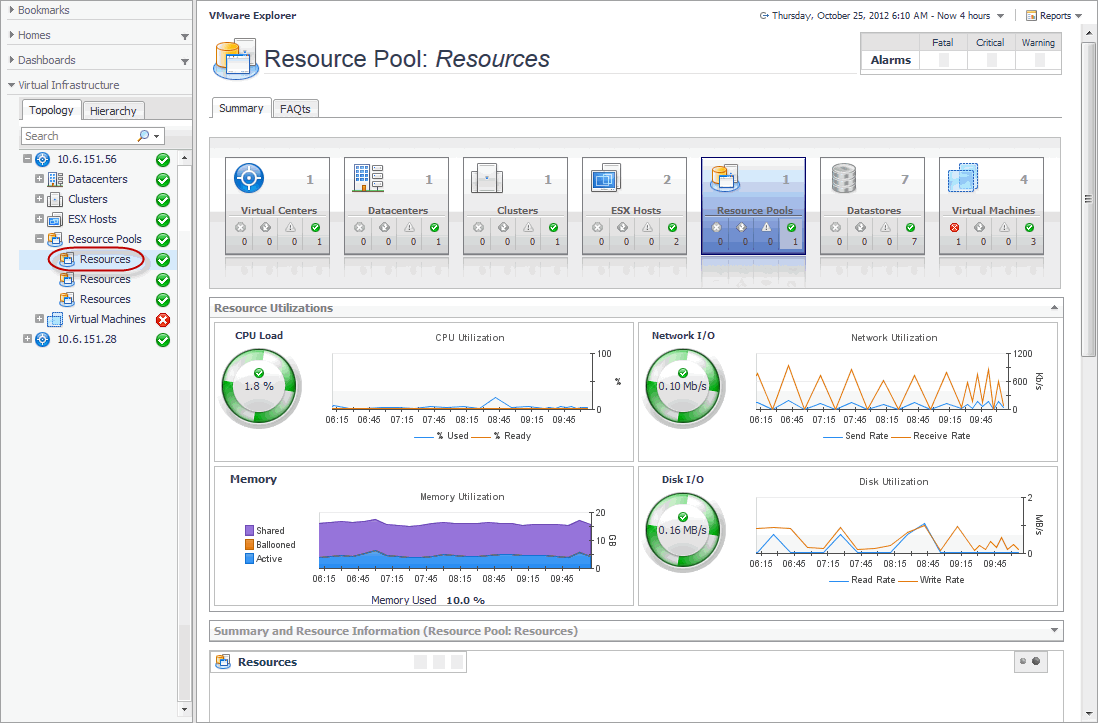
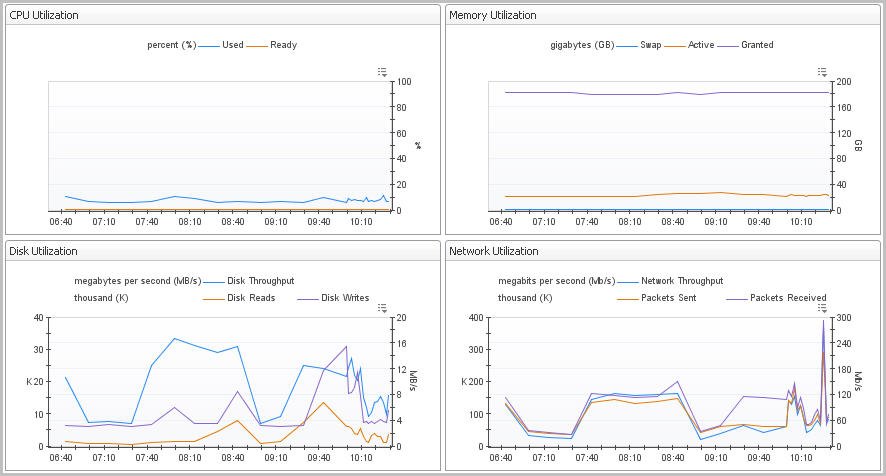
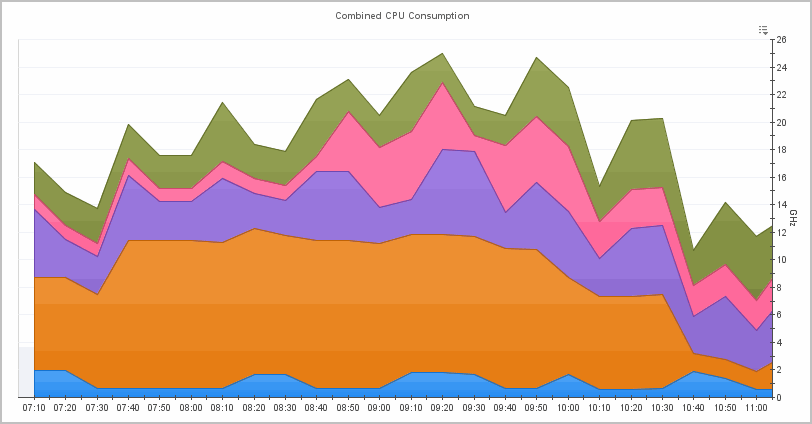
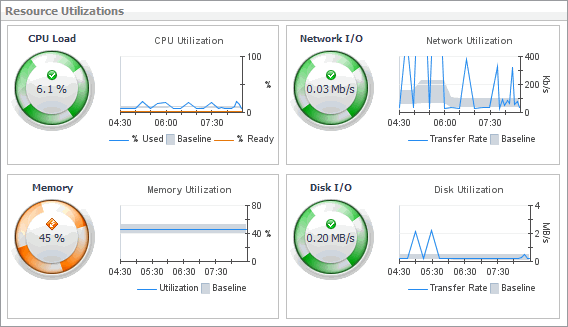
The Utilizations view, typically located across the center of the display area tab, provides numerical and graphical representations of utilization metrics associated with the selected object or group of objects. For example, selecting a single resource pool from the Virtual Infrastructure view and opening the Performance tab in the display area, displays four graphs in the Utilizations view, showing CPU, memory, disk, and network resource utilizations for the selected resource pool.
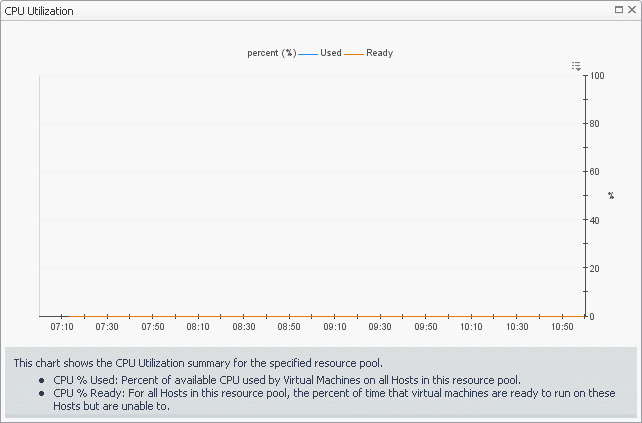
If you open the VMs tab for that same resource pool, the Utilizations view displays one graph illustrating the percent-used and percent-ready CPU utilization for the virtual machines of the resource pool.
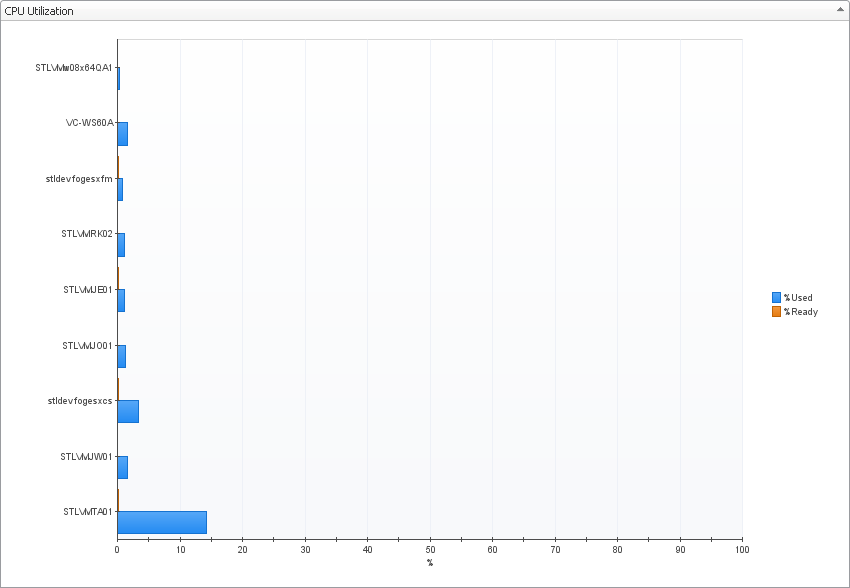
If, however, you select a collection of ESX Hosts from the Virtual Infrastructure view and you open the Summary tab, an informative graph appears in place of a Utilizations view. Selecting a collection of objects in the Virtual Infrastructure view always shows a composite view displaying information about all object instances contained in that collection.
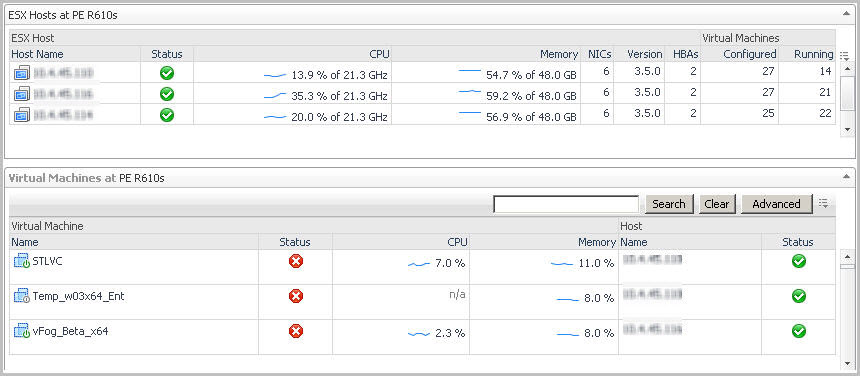
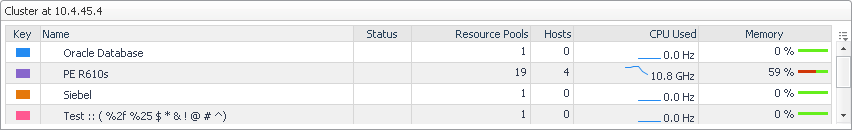
In addition to the Utilizations view, one or more Related Objects views may appear at the bottom of the display area. These views take the form of tables and list either the parent or child objects or both (whichever are applicable) of the object being viewed, and provide pertinent details about each one. Their appearance depends on the type and range of objects selected in the Virtual Infrastructure view.
However, when you select a cluster container, the Summary tab shows a Related Objects view that lists all of the clusters in that container and provides pertinent details about each one.
Start creating a custom dashboard by clicking Create dashboard on the action panel. From there, create a view and add one or more of the data elements listed above. For complete information about custom dashboards and how to get started, refer to the Foglight Evolve Cloud User Help and the Creating Custom Dashboards learning video.
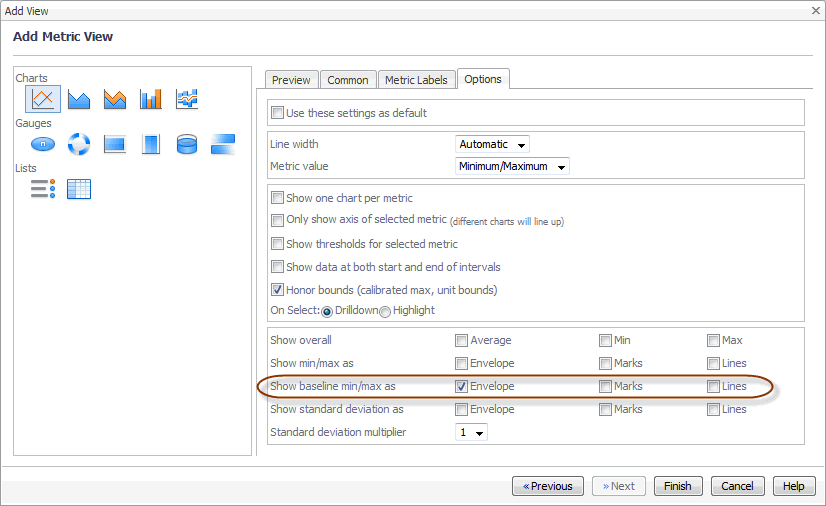
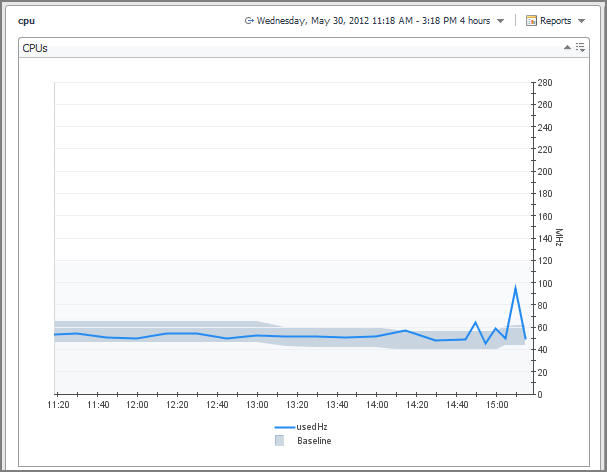
Before finishing, edit the view properties and enable the appearance of the baseline minimum and maximum values by selecting one or more of the Show baseline min/max as check boxes.
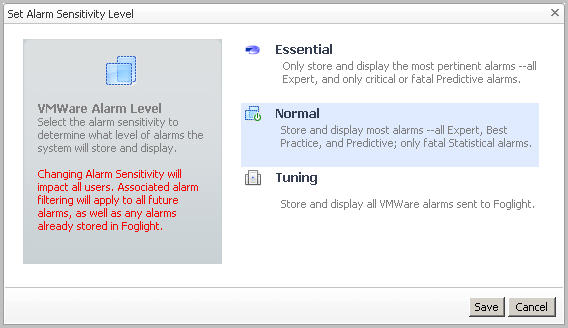
The VMware Agent Administration dashboard enables you to configure the level of alarm sensitivity. The VMware Monitoring in Foglight® Evolve Cloud alarm sensitivity reflects the level of alarms the system stores and displays.
|
1 |
On the VMware Agent Administration dashboard click Set Alarm Sensitivity Level. |
|
3 |
Click Save. |
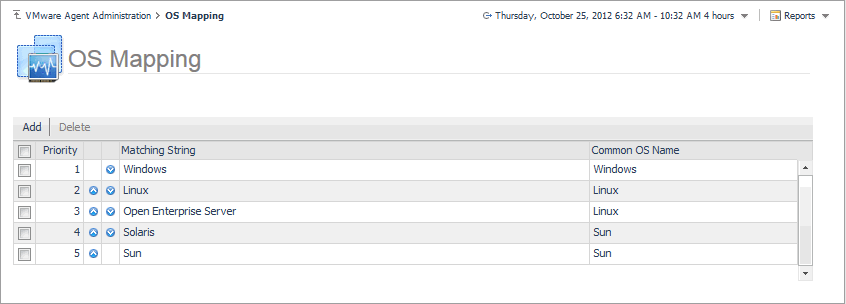
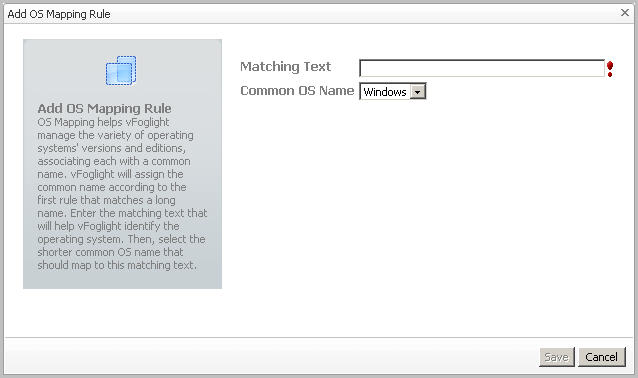
OS mapping involves associating various versions and editions of a particular operating system with a common OS name. You configure OS mapping rules using the Administration tab on the VMware Environment dashboard. This helps VMware Monitoring in Foglight Evolve Cloud map the OS names reported by VMware Monitoring in Foglight Evolve Cloud to those reported by physical OS monitoring, so that you can view all Windows machines, all Linux machines, and so on.
For reference information about this view, see OS Mapping view .
|
• |
On the VMware Agent Administration dashboard, click Configure OS Mapping. |
|
1 |
|
2 |
In the Add OS Mapping Rule dialog box, in the Matching Text box, type the OS name with its edition and/or version number to help VMware Monitoring in Foglight Evolve Cloud identify the operating system. |
|
3 |
In the Common OS Name list, select the shorter common OS name. |
|
4 |
Click Save. |
|
1 |
In the OS Mapping view, select an OS mapping rule by clicking the associated check box in the left column. |
|
2 |
Click Delete. |
|
3 |
Click Save. |
|
• |
In the OS Mapping view, move a rule one level up by clicking the up arrow in the rule’s row. |