Chat now with support
Chat mit Support

Foglight for VMware 5.8.3 - User Guide (Lite version)

Using VMware Monitoring in Foglight Evolve Cloud Reference Appendix: Alarm Messages Appendix: Metrics

Agents view

This view displays a list of the existing VMware Performance Agent instances and shows their status. Use it to verify that your agents are collecting data from the monitored environment.

Figure 71. Agents view

The Agents view appears at the bottom of the Administration tab.
Active. Indicates if the VMware Performance Agent process is running.
Agent Name. The name of the VMware Performance Agent instance.
Agent Version. Indicates if the agent is running the latest version of the agent package (), or it needs to be updated ().
Alarms. The total numbers of Warning, Critical, and Fatal alarms.
Data Collection. Indicates if the VMware Performance Agent is collecting data from the monitored environment.
Download Log. Allows you to download the agent log file.
Edit Properties. Allows you to edit the agent’s properties.
Foglight Agent Manager Host. The name of the machine on which the Agent Manager and the VMware Performance Agent process are running.
Metric History. The progress of the import of historical data. Each VMware Performance Agent monitors a single Virtual Center. When you create a VMware Performance Agent instance and the Agent Setup wizard determines that the Virtual Center was not previously monitored by this Foglight Evolve Cloud instance, it starts importing historical data into Foglight Evolve Cloud. This data is not immediately available as it takes some time to collect it. This process can import data collected over 30 days or less, depending on the amount of data available in the Virtual Center. This allows you to explore VMware metrics as soon as the data is imported, instead for waiting for the agent to collect some data from the Virtual Center. Historical data is intended for charting, trending, and general presentation purposes. It does not cause any alarms to fire.

Click this column to start a metric history import, or to see its progress. When the import is in progress, you have an option to cancel it, if needed.

Click Cancel in the dwell to cancel the import. You can resume it at a later time.

When the metric history import is completed, this is indicated in the dwell.

Instances and Limits view

This view displays the list of the existing VMware object types. This information can give you insight into the size of your database and whether additional adjustments are required to improve your system performance.

On the VMware Environment dashboard, on the Administration tab, click Review Instances and Limits.
The Instances and Limits view appears in the display area.
Instance Count. The current number of object instances of this type.
Instance Limit. The maximum number of object instances of this type that can be instantiated.
Object Type. The type of the topology object.
Status. The current status representing the highest severity level associated with an instance of that type.
Utilized. The percentage of the object limit instance that is currently utilized.

OS Mapping view

You configure OS mapping rules using the OS Mapping view. OS mapping is the mapping of the various versions and editions of a particular operating system to a common OS name. This helps VMware Monitoring in Foglight Evolve Cloud manage the variety of versions and editions of each OS.

Figure 73. OS Mapping view

On the VMware Environment dashboard, on the Administration tab, click Configure OS Mapping.
The OS Mapping view appears in the display area.
Common OS Name. The OS name.
Matching String. The OS name to be matched against existing OS names.
Priority. The matching priority. Selecting a mapping and clicking or allows you to edit the priority sequence.

Metrics Collection Management View

The Metrics Collection Management view is used to configure the metrics collect by agent. VMware agent has collect total 99 metrics from vCenter, but some metrics are not used to VMware dashboard and relate products (Capacity Director, Optimizer and so on), less metrics collection can reduce the pressure of collection from vCenter and improve performance for agent on large environment. This view is for this purpose and user can disable the collection of these metrics at this view.

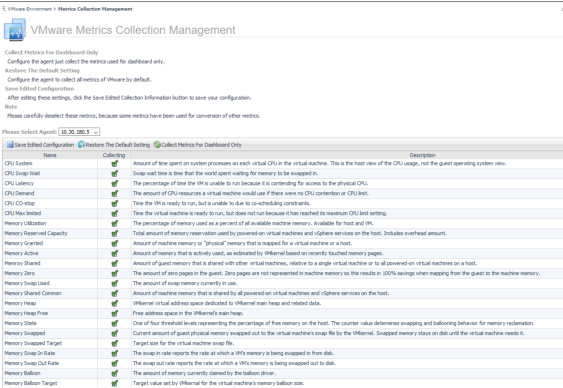
Please select agent: select the agent which need configure.
Collect Metrics For Dashboard Only: Configure the agent just collect the metrics used for dashboard only.
Restore The Default Setting: Configure the agent to collect all metrics of VMware by default.
Save Edited Configuration: After editing these settings, click the Save Edited Collection Information button to save your configuration.

Data displayed

Name: The metrics name.
Collecting: Agent collect this metric or not, agent collect it when it selected.
Description: The description of metric.

Lists the summary and resource information of the selected virtual machine.

Current Status. The current status of the selected virtual machine: Turned off or Powered On.
Processors. The number of CPUs used by the selected virtual machine.
Uptime. The percentage of time during which the virtual machine is running.
Memory Capacity. The amount of memory resources allocated to the selected virtual machine.
Powered on Date. The date on which the selected virtual machine is powered.
Network Interface. The number of network interface cards that exist on the selected virtual machine.
OS Reboot Date. The date when rebooting the operating system.
Storage Devices. The number of physical and logical disks associated with the virtual machine.
DNS Name. The fully qualified DNS name of the selected virtual machine.
Virtual Center. The IP address of the Virtual Center to which the virtual machine belongs.
Connection Status. The virtual machine’s connection status.
Datacenter. The name of the datacenter associated with the virtual machine.
IP Address. The IP address of the virtual machine.
Cluster. The name of the cluster associated with the virtual machine.
Vmware Tools. The name of VMware applications used to manage the virtual machine.
Resource Pool. The name of resource pools associated with the virtual machine.
OS. The name of the operating system used by the selected virtual machine.
ESX Host. The IP address of the ESX host on which the virtual machine is running.
Managed Object Reference. Identifies the virtual switch in your monitored environment.
Verwandte Dokumente

The document was helpful.

Bewertung auswählen

I easily found the information I needed.

Bewertung auswählen