Chat now with support
Chat mit Support

Foglight for VMware 5.8.3 - User Guide (Lite version)

Using VMware Monitoring in Foglight Evolve Cloud Reference Appendix: Alarm Messages Appendix: Metrics

Summary (All Servers) tab

The Summary (All Servers) tab shows a summary of system resources for all ESX hosts that currently exist in a selected Virtual Center.

2
On the Virtual Infrastructure view, that appears on the navigation panel, select the ESX Hosts node.

This view is made up of the following embedded views:

Shows the combined percentage of the CPU usage for all ESX hosts in the system.

Combined CPU Consumption %. The combined percentage of the CPU utilization used by all ESX hosts to execute system code and user programs during the selected time period.

Drill down on:

Combined CPU Consumption %. Displays the Combined CPU Consumption dialog box.

Table 44. ESX hosts

This tabular view lists all ESX hosts that exist in your environment.

ESX host, CPU. The current amount of the CPU speed that is used by the ESX host.
ESX host, Key. The color used in the Combined CPU Consumption chart to represent the ESX host.
ESX host, Memory. The current percentage of memory that is used by the ESX host.
ESX host, NICs. The number of network interface cards used by the ESX host.
ESX host, ESX host Name. ESX host name.
ESX host, Status. The ESX host status, associated with any alarms raised against it. If no alarms are fired, the status appears as Normal. Otherwise, the status is set to the highest alarm severity (Warning, Critical, or Fatal).
ESX host, Version. The version number of the Windows OS running on the ESX host.
Virtual Machines, Configured. The number of virtual machines that exist on the ESX host.
Virtual Machines, Running. The number of virtual machines that are running on the ESX host.

Drill down on any ESX host entry. The VMware Environment dashboard appears, showing the ESX host details on the Summary tab.

This embedded view shows the same information as the Virtual Environment view appearing on the Summary (All Clusters) tab. See page 97 for complete information.

Summary (All Virtual Machines) tab

The Summary (All Virtual Machines) tab shows a summary of system resources for all virtual machines that currently exist in the selected Virtual Center.

2
On the Virtual Infrastructure view, select a Virtual Machines node.

This view is made up of the following embedded views:

This embedded view shows the same information as the Virtual Environment view appearing on the Summary (All Clusters) tab. See page 97 for complete information.

This tabular view lists all virtual machines that exist in the selected Virtual Center.

Virtual Machine, Name. The name of the server on which the virtual machine is running.
Virtual Machine, Status. The status of the server on which the virtual machine is running, associated with any alarms raised against it. If no alarms are fired, the status appears as Normal. Otherwise, the status is set to the highest alarm severity (Warning, Critical, or Fatal).
Virtual Machine, CPU. The percentage of the virtual machine’s CPU utilization spent on executing system code and user programs.
Virtual Machine, Name. The virtual machine name.
Virtual Machine, Status. The virtual machine status, associated with any alarms raised against it. If no alarms are fired, the status appears as Normal. Otherwise, the status is set to the highest alarm severity (Warning, Critical, or Fatal).
Virtual Machine, Memory. The total amount of memory allocated to the virtual machine.

Drill down on any virtual machine entry. The VMware Environment dashboard appears, showing the server details on the Summary tab.

Virtual Infrastructure view

The Virtual Infrastructure view provides an organized view of the various virtual infrastructure objects that are monitored by VMware Monitoring in Foglight Evolve Cloud. It serves as a navigation tool, and it also presents pertinent alarm information.

When you select an object from the Virtual Infrastructure view, all of the views in the VMware Explorer dashboard are updated with information pertaining to that object.

The Virtual Infrastructure view appears on the navigation panel.

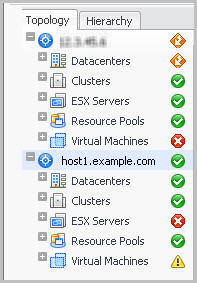
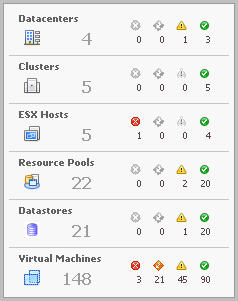
The Virtual Infrastructure view is made up of the following embedded views:

The Topology view is organized into a tree using object type (or topology type) containers for branches.

Within the Topology view, all of the virtual infrastructure objects are organized into a tree using object type (or topology type) containers for branches. The top-level objects in the Topology view are always the vCenters.

The top-level objects in the Topology view are always the VirtualCenters.

Each VirtualCenter in the Topology view contains several object type containers, and each object type container contains every object of that particular type that is managed by the parent VirtualCenter.

Each object type container, as well as each object, has a representative icon that is displayed to the left, as shown in the following table.

VirtualCenter

VMWVirtualCenter

Datacenter

VMWDatacenter

Cluster

VMWCluster

ESX Server

VMWESXServer

Resource Pool

VMWResourcePool

Virtual Machine

VMWVirtualMachine

Datastore

VMWDatastore

At the right, the Topology view displays status indicators. For an individual object, the status indicator represents the alarm of highest severity that is outstanding for that object. For an object type container, the status indicator represents the alarm of highest severity that is outstanding for all objects of that type.

The Hierarchy view represents the logical layout of VirtualCenter management servers, so it is not organized into groups of common objects.

Within the Hierarchy view, each VirtualCenter object is organized into a tree that has the same hierarchical structure as the VirtualCenter and displays the objects (datacenters, clusters, resource pools, virtual machines, folders, etc.) within the VirtualCenter as branches.

In the Hierarchy view, each VirtualCenter object is organized into a tree that has the same hierarchical structure as the corresponding VirtualCenter, displaying the objects (for example, datacenters, clusters, resource pools, virtual machines, and folders) within the VirtualCenter as branches.

Each object in the Hierarchy view has a representative icon that is displayed at the left of the object’s name. These icons are shown in the table in Topology Tab .

At the right, the Hierarchy view displays status indicators. Each status indicator represents the alarm of highest severity that is outstanding for the corresponding object.

When you hover the cursor over an object in the Virtual Infrastructure view, you see a popup that provides a summary of the present state of that object.

The following image shows the popup you see when you hover the cursor over a VirtualCenter object in the Virtual Infrastructure view.

VMware Agent Administration views

VMware Agent Administration views

The VMware Environment dashboard contains the following views:

Verwandte Dokumente

The document was helpful.

Bewertung auswählen

I easily found the information I needed.

Bewertung auswählen