
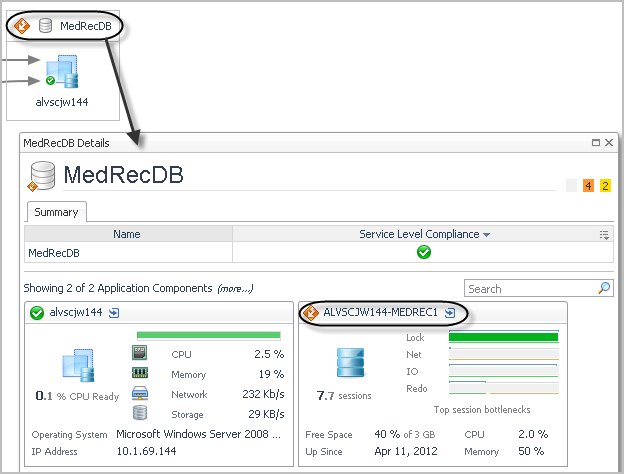
Database layer
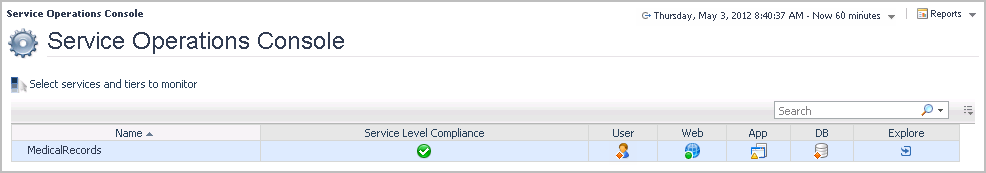
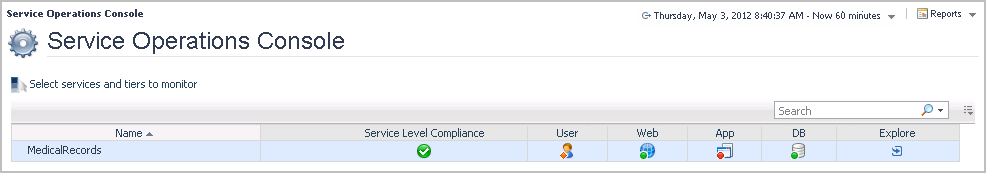
Only one service is shown in this example, but in a typical environment, there would be several.
|
2 |
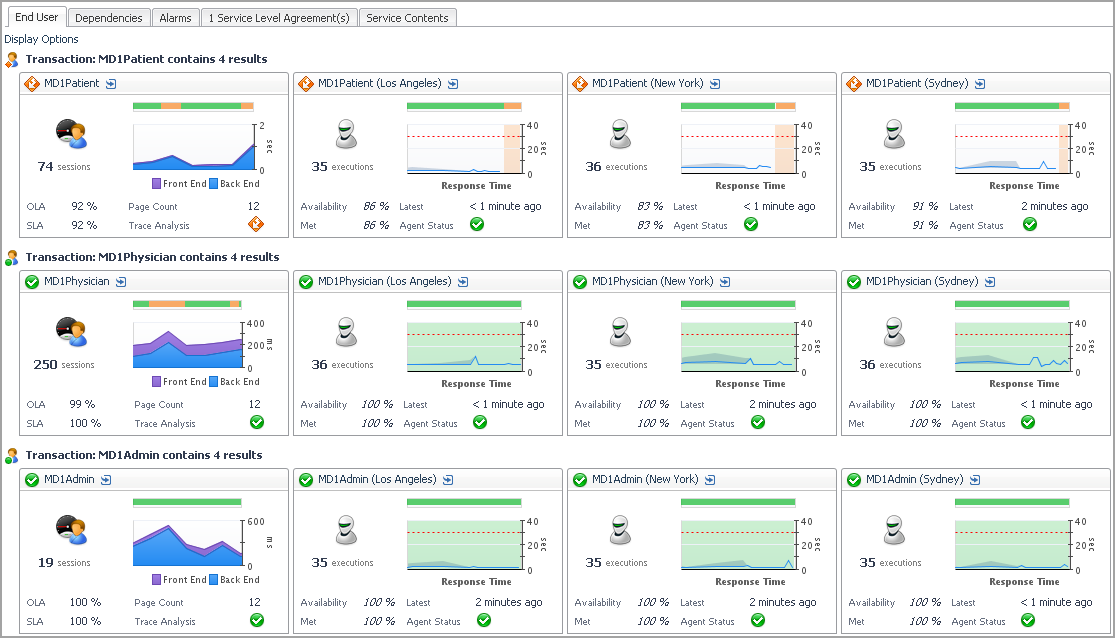
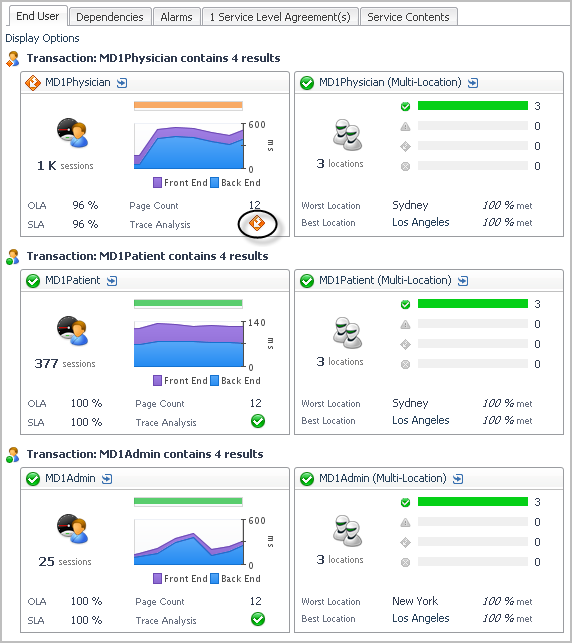
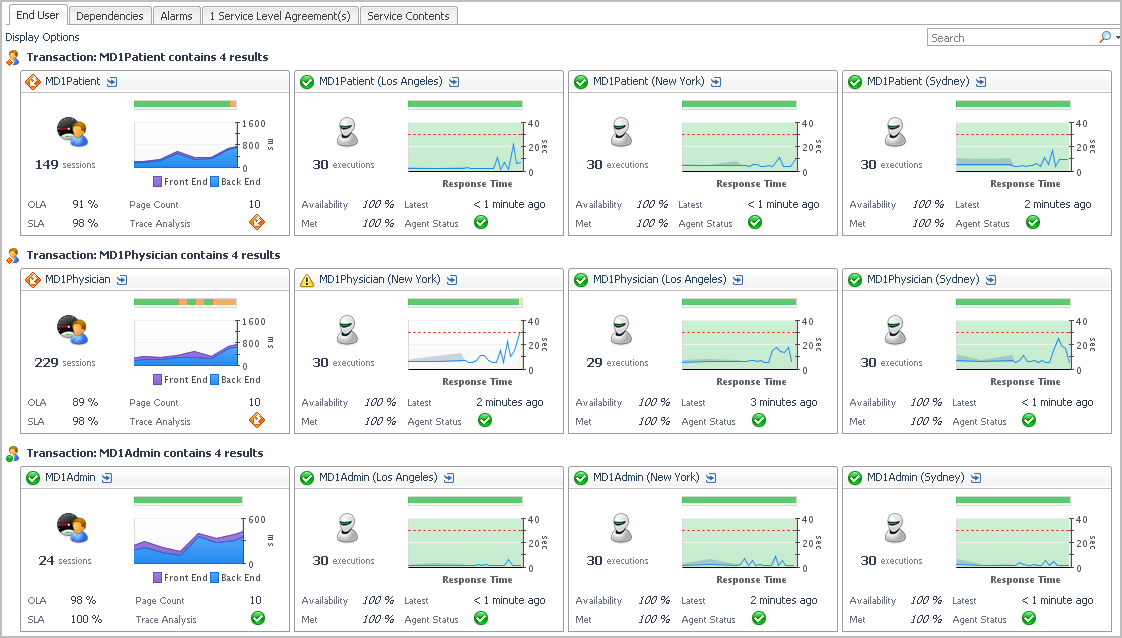
Review the Transactions tab to determine the impact on users. |
|
Beginning at 09:35, users are experiencing a longer response time. | |
|
At 09:35, the number of page requests is slightly lower than earlier peak loads. This indicates that the problem is not due to a spike in user activity. | |
|
Also at 09:35, the Service Level Agreement (SLA) and Operating Level Agreement (OLA) are still being met, but the percentage is decreasing. | |
|
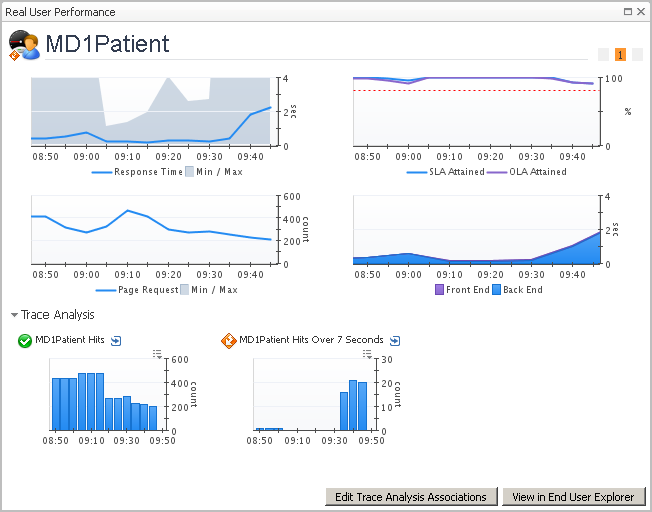
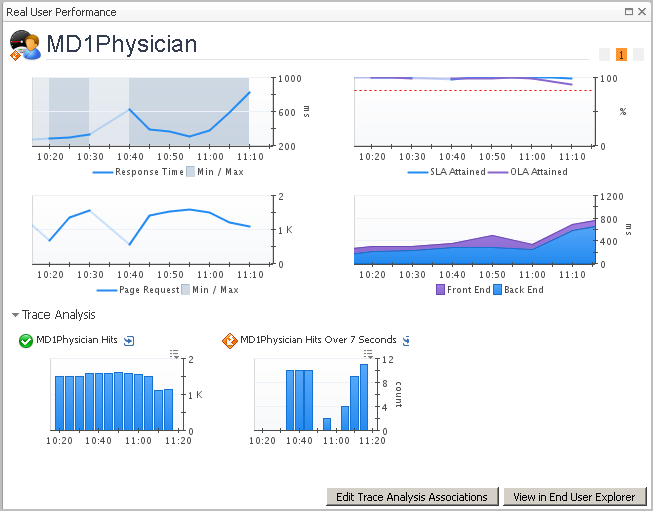
The overall number of hits has decreased, as shown in the MD1Patient Hits chart. |
|
NOTE: Click the title bar of the MD1Patient Hits Over 7 Seconds chart to drill down into the individual sessions recorded by FxV. The FxV details allow you to see the Hit URLs and error messages, and to drill down into individual sessions, where you can step through a session to locate the error point. In this case, drilling down to the sessions shows that this is a content error issue. Some users are seeing error messages in their web browsers. This increases the priority of this issue. |
|
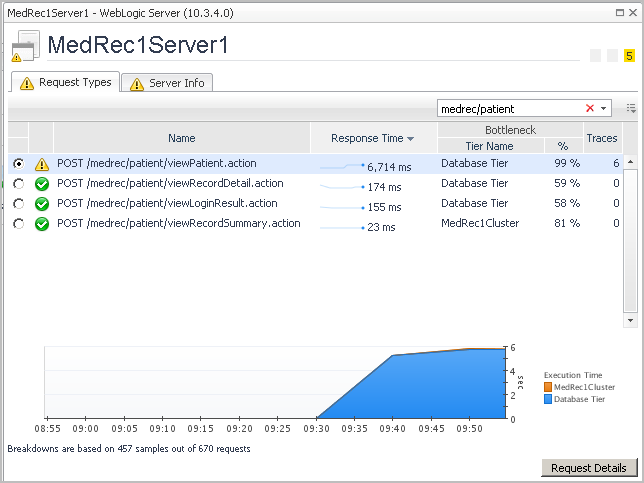
TIP: Use the Search box to filter the list of requests. Type medrec/patient to include only those requests with that string in the name. |
|
7 |
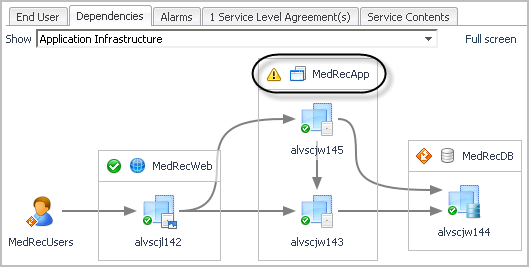
On the Dependencies tab, click the title bar of the MedRecDB database tier to drill down for more details. |
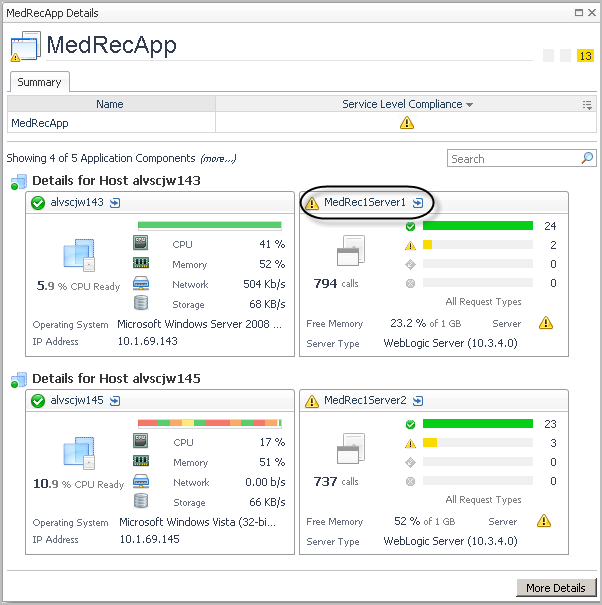
Application layer
|
2 |
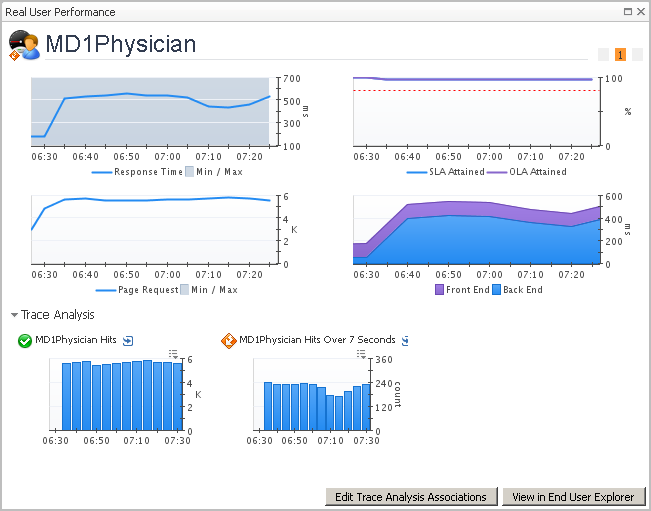
Review the Transactions tab to determine the impact on users. |
|
Starting at 06:30, the response time has increased slightly, but the increase is constant. | |
|
The MD1Physician Hits Over 7 Seconds chart shows the number of users experiencing a delay of more than seven seconds in their transaction execution has increased and remains high. |
|
4 |
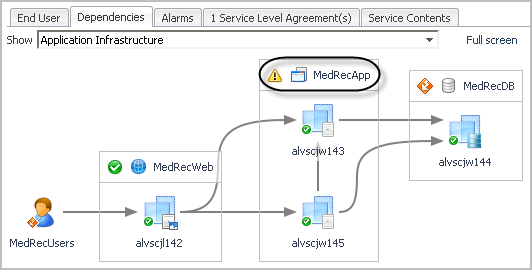
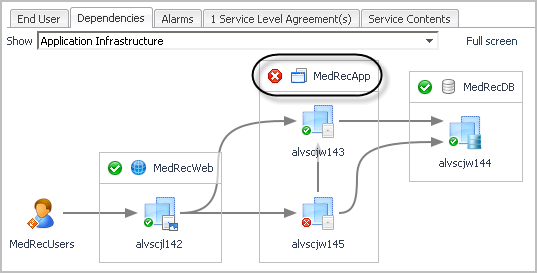
Click the Dependencies tab to view the application topology. |
|
5 |
Click the MedRecApp application tier title bar to drill down for more details. |
|
TIP: If one of the hosts was experiencing an issue, you could click the host icon to drill down into a Host detail view instead of looking at the tier view. |
|
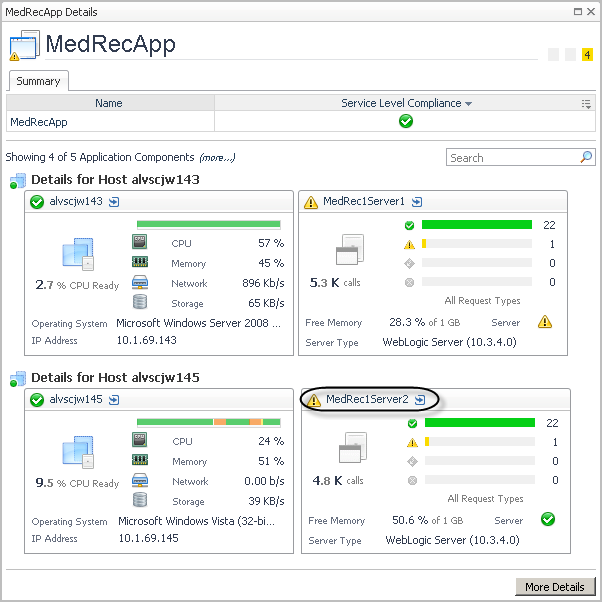
6 |
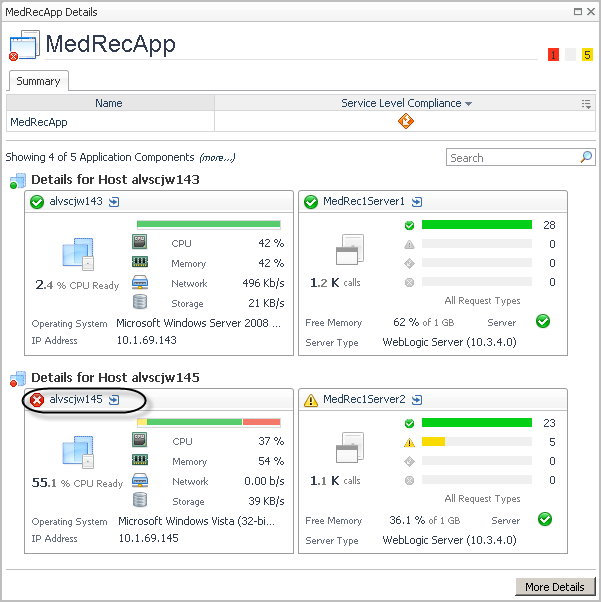
Click the title bar of the MedRec1Server2 application component tile to open the Application Details view. |
|
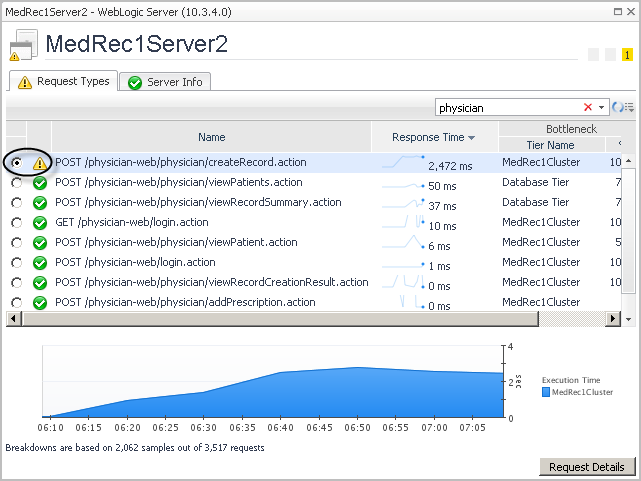
TIP: Use the Search box to filter the list of requests. Type physician to include only those requests with that string in the name. |
Virtual machine
|
1 |
|
2 |
Review the Transactions tab to determine the impact on users. |
|
3 |
Click the title bar of the MD1Physician Real User tile to drill down for more information. |
|
• |
The number of requests taking over seven seconds (MD1Physician Hits Over 7 Seconds) is increasing. |
|
4 |
Click the Dependencies tab to view the application topology. |
|
TIP: You could click the title bar of the MedRec1Server2 tile to drill down to the requests. In some cases, the requests can also provide more evidence to support your conclusions about the source of the issue. |
|
6 |
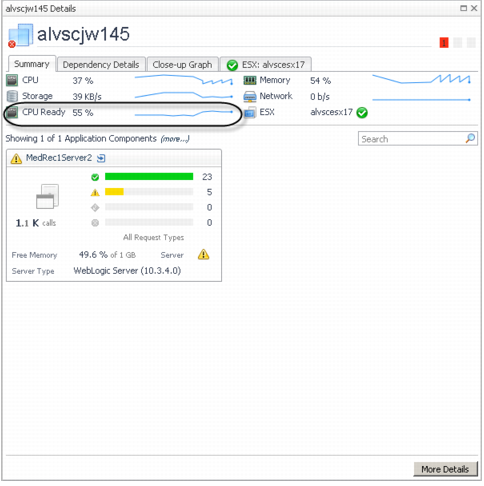
Click the title bar of the host tile with the fatal alarm (alvscjw145) to drill down for details. |
|
7 |
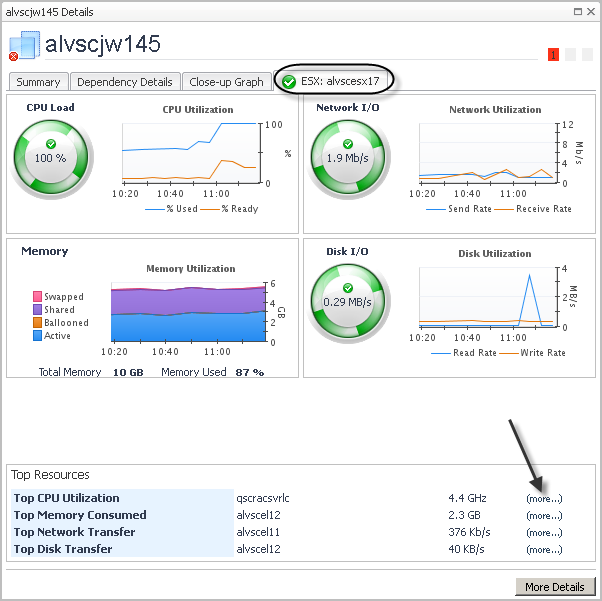
Click the ESX tab to investigate the state of the host server and the virtualization layer. |
|
8 |
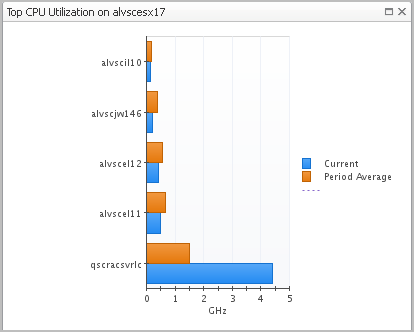
Click the (more...) link for the Top CPU Utilization to compare the CPU usage of the hosts on this server. |
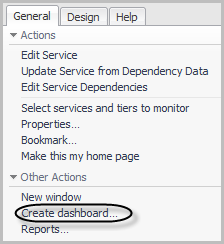
Creating Custom Drag-and-Drop Dashboards
|
2 |
|
3 |
|
5 |
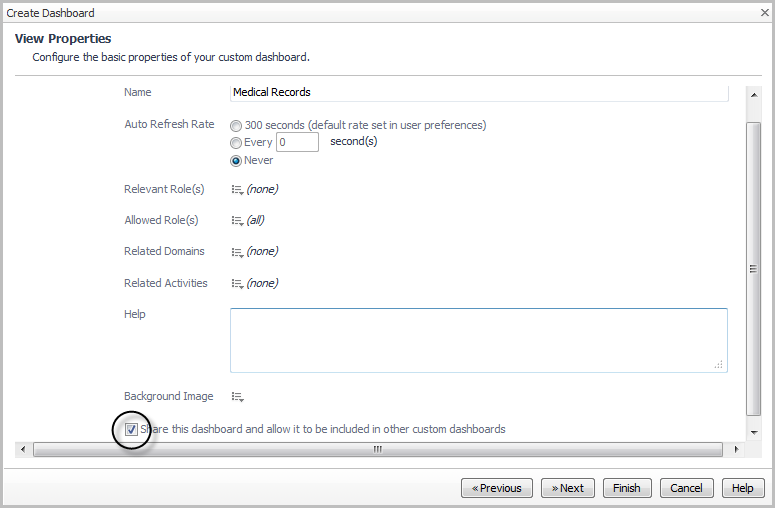
Select the Share this dashboard and allow it to be included in other custom dashboards check box. |
|
6 |
Click Next. |
|
7 |
On the Select Dashboard Layout page, select Fixed Size. |
|
8 |
Click Finish. |
|
1 |
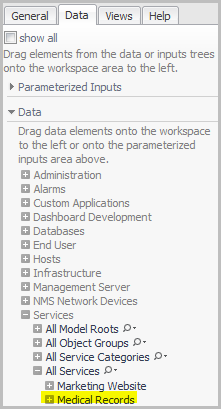
On the action panel, click the Data tab. |
|
2 |
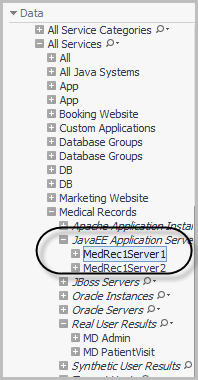
In the Data list, expand Services > All Services. |
|
4 |
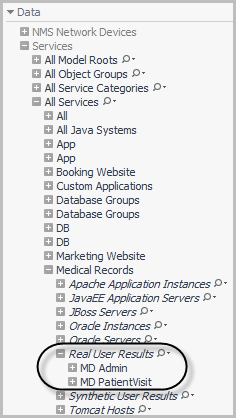
Expand Real User Results and select the application component (for example, MD Admin). |
|
6 |
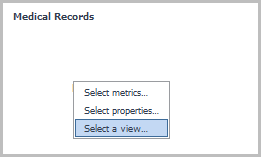
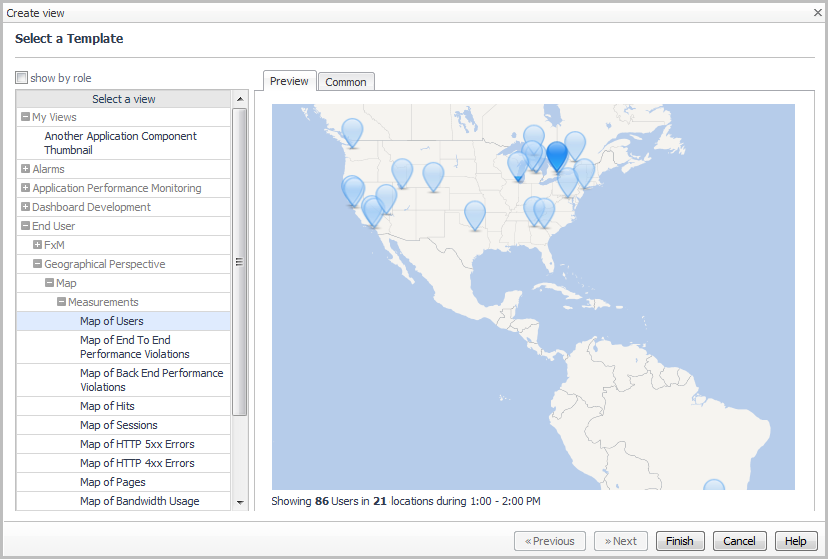
Click Select a view. The Create View wizard opens. |
|
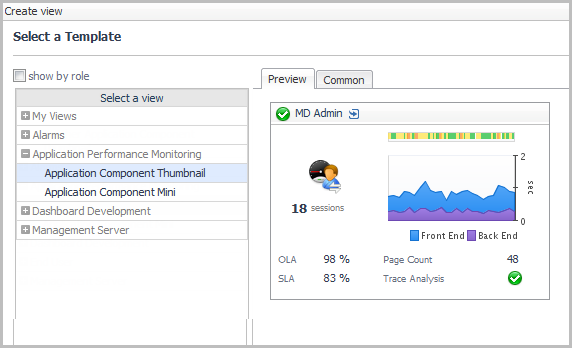
7 |
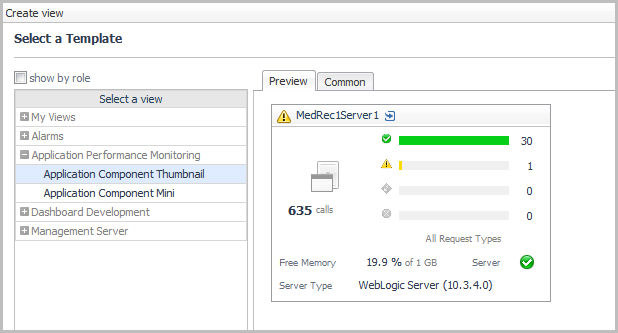
On the Select a Template page, expand Application Performance Monitoring, and click Application Component Thumbnail. |
|
8 |
Click Finish. |
|
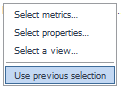
10 |
From the menu that opens, click Use previous selection. |
|
1 |
From the Data list in the action panel, drag and drop Synthetic User Results onto the dashboard display area. |
|
2 |
From the menu that opens, select Create a table. The Create View wizard opens. |
|
3 |
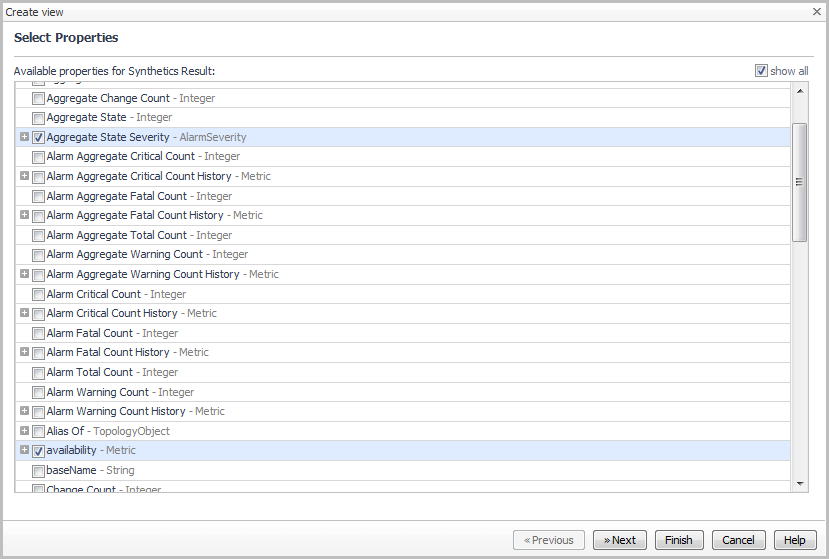
On the Select Properties page, select the Show All check box. |
|
5 |
Click Next. |
|
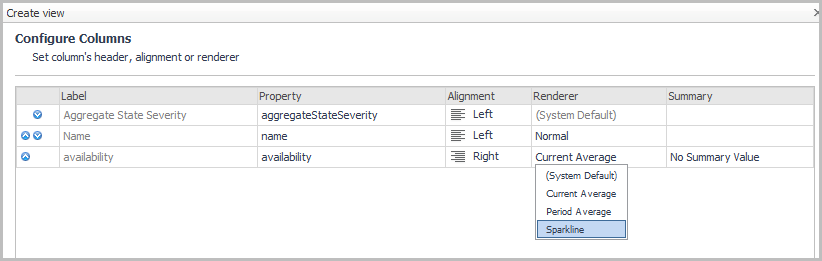
6 |
On the Configure Columns page, click in the Renderer box for the availability property and select Sparkline from the list. |
|
7 |
|
8 |
|
9 |
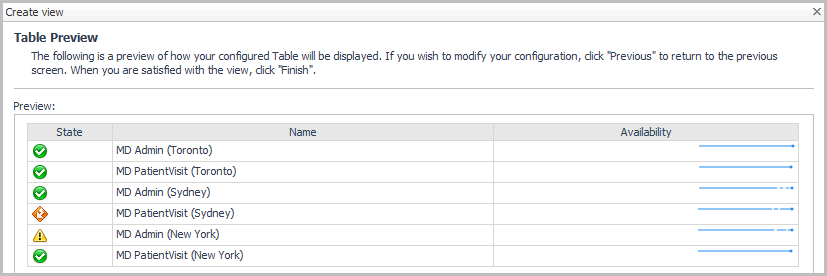
Click Next. |
|
11 |
On the action panel, click the General tab. |
|
12 |
Click Edit page layout. |
|
15 |
Click Done to lock the views in place and continue adding views. |
|
1 |
On the action panel, click the Data tab. |
|
3 |
From the menu that opens, click Select a view. |
|
4 |
Expand End User > Geographical Perspective > Measurements. |
|
5 |
Select Map of Users. |
|
6 |
Click Finish. |
|
8 |
From the menu that opens, click Use previous selection. |
|
9 |
On the action panel, click the General tab. |
|
10 |
Click Edit page layout. |
|
2 |
Drag and drop an application server from the JavaEE Application Servers list (for example, MedRec1Server1). |
|
3 |
On the menu that opens, click Select a view. |
|
4 |
|
5 |
Click Finish. |
|
7 |
On the menu that opens, click Use previous selection. |
|
9 |
Expand Oracle Instances and drag and drop a database server instance onto the dashboard (for example, MEDRECDB-MEDREC1). |
|
10 |
On the menu that opens, click Select a view. |
|
11 |
Expand Application Performance Monitoring and click Application Component Thumbnail. |
|
12 |
Click Finish. |
|
13 |
On the action panel, click the General tab. |
|
14 |
On the dashboard, click Done. |
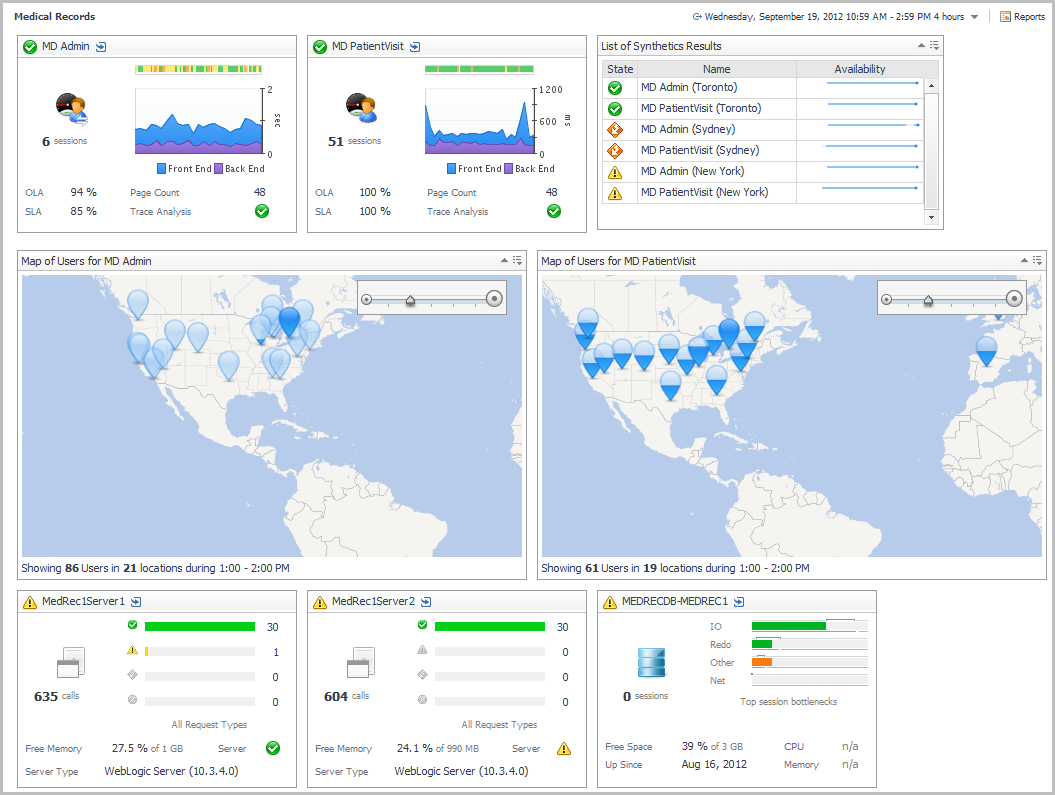
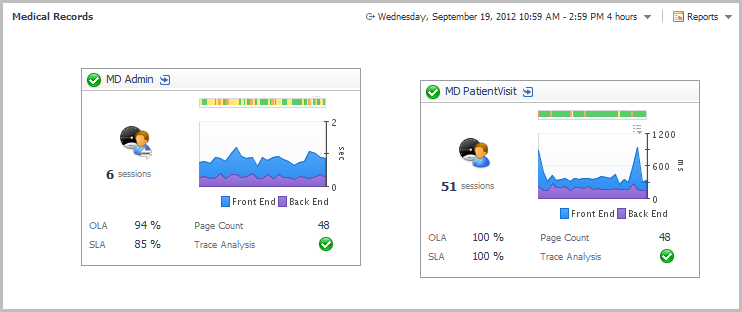
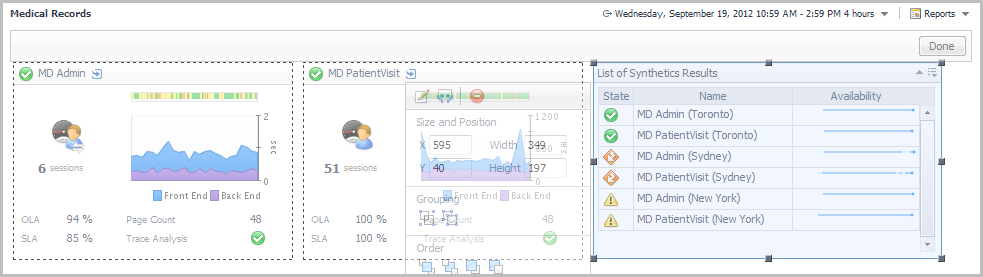
The at-a-glance custom dashboard is now complete.
You can link this dashboard to the Explore icon for the service it represents on the Service Operations Console. For more information, see Linking a custom dashboard to the Explore icon for a service.