
Next steps
From the Error Breakdown Explorer you can:
|
• |
Click Find Related Hits — If you are using Foglight APM Appliances, you can drill down to the Search Hits page, where you can investigate pivots or map the hit. From there you can also replay the content of the hit as the affected end user saw it to determine exactly where an issue occurred. For more information about searching hits, see the Foglight APM User Guide. |
|
• |
Click Request Details — Opens the Requests view, which allows you to review the details of the request, including: response times and completed calls, sampled breakdowns, and incomplete or exceptional exits. |
|
TIP: You can also collect traces from this view (select the request and click Collect Traces). For more information, see Monitoring requests in the Foglight for Application Servers User Guide. |
|
• |
Click Examine Trace — If you have collected traces for a request, you can drill down to the trace details. For more information about the Traces View, see Managing traces in the Foglight for Application Servers User Guide. |
Viewing Real User Activity from a Geographical Perspective
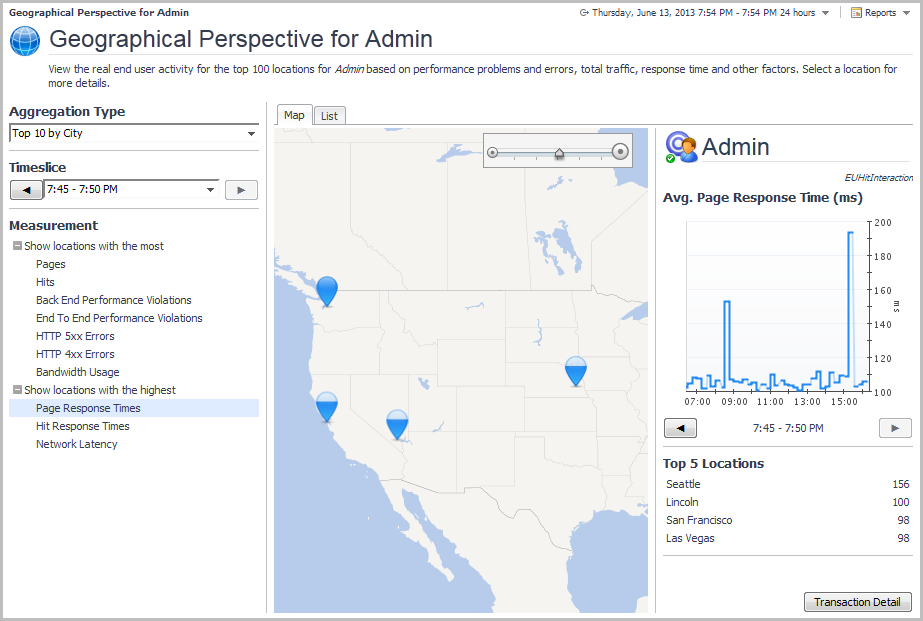
The Geographical Perspective dashboard is divided into three panes. The pane on the left contains lists of: available aggregation types, timeslices, and measurements. The center pane displays either a map, if the Map tab is selected, or a list of results in a tabular format, if the List tab is selected. The pane on the right provides graphical results from the measurements, and the option to drill down for more information.
|
NOTE: If you are using a version 5.6.4 Management Server, only the List tab is available. The Map tab requires Management Server 5.6.5 or later. If you are using Internet Explorer® (IE) 8 or earlier, only the List tab is available. |
|
1 |
On the navigation panel, under Dashboards, click APM > Geographical Perspective. |
|
2 |
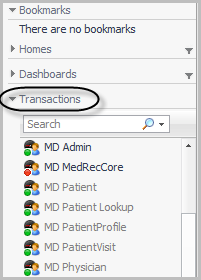
Select a transaction from the Transactions list at the bottom of the navigation panel. |
|
3 |
On the left side of the dashboard, select an Aggregation Type: top ten by city, country, or region. |
|
4 |
Select a Measurement from the list to view the related transaction data. The map and right pane update based on your selection. |
|
5 |
Select a timeslice from the Timeslice list, or use the forward or back arrows to step through the available timeslices. |
|
6 |
Click Transaction Detail (in the lower right corner of the right pane) to open the Summary view for the transaction. For more information about this view, see Real User (APM) Performance detail view. |
|
8 |
|
9 |
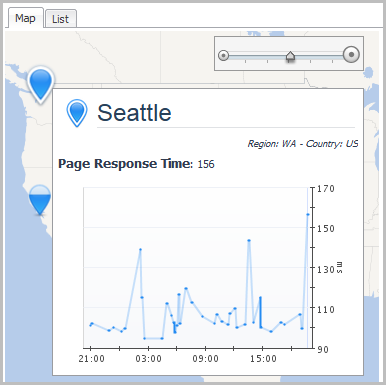
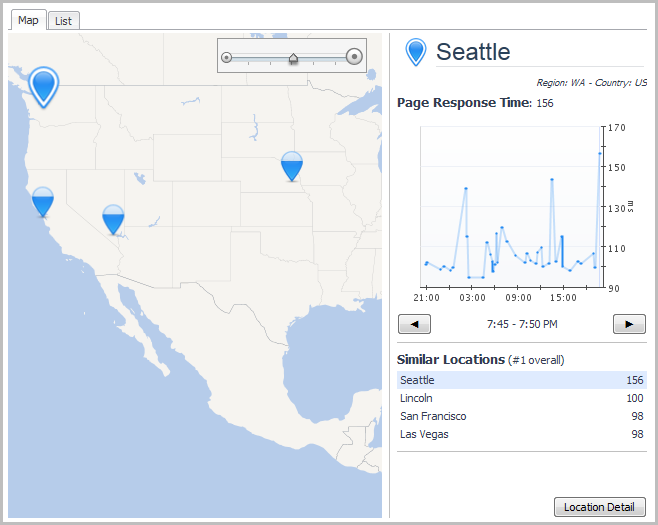
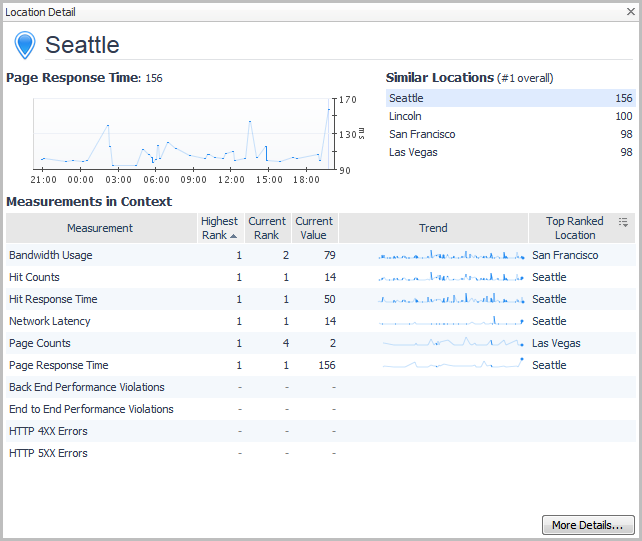
Click Location Detail to drill down to detailed information for the selected location. |
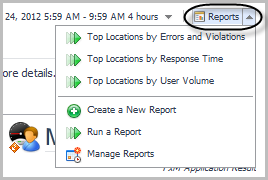
Generating geographical perspective reports
|
• |
Click Reports at the top right corner of the Geographical Perspectives dashboard. |
Using the SOC Transactions Tab
The Transaction tab displays data from the following specific end user monitoring systems:
|
• |
Foglight Transaction Recorder (FTR) — A Windows®-based application that records and plays back synthetic web transactions at regular intervals. |
The Transaction tab can also display application-specific transaction data (that is, Java™ EE or .NET® transactions) with or without end user data. For more information, see Investigating application server transactions.
For a full list of all domain-specific tiles available through the SOC Transactions tab, see APM Tile and View Reference.