
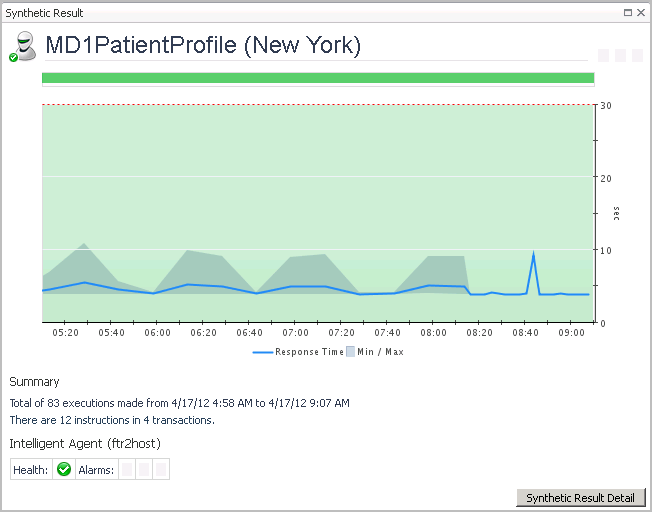
Synthetic Result detail view
|
Health History Bar. The color-coded bar represents the alarm state of the monitored component over the time range selected in the SOC. The color of the bar changes depending on the alarm state. Red indicates a Fatal state, orange indicates Critical, yellow means Warning, and green is the Normal state. | |||
| |||
| |||
| |||
|
|
• |
Click Synthetic Result Detail to see the script execution statistics in the End User Explorer dashboard. For more information about this dashboard, see the Foglight Transaction Player User and Reference Guide. |
Synthetic User Performance detail view
The Synthetic User Performance detail view provides a container view of results from all locations for a selected synthetic transaction. Each location is displayed in a single tile view that provides the same information as the Single-Location Synthetics tile.
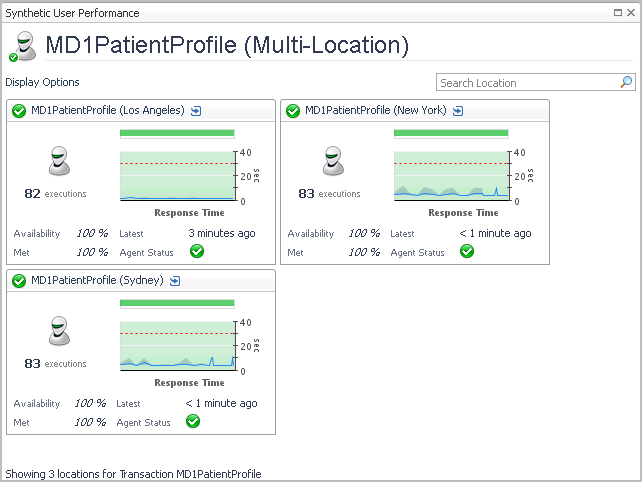
Click the title bar of any tile to drill down to the Synthetic Result detail view for that location.
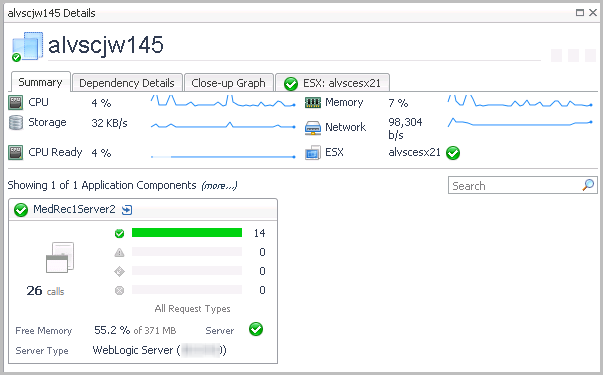
Virtual Machine detail view
The Virtual Machine (VM) detail view provides high-level performance metrics for both the currently selected VM and for its host ESX® Server, and tiles for any application components running on the selected VM.
|
• |
|
• |
Click More Details (not shown, located at the bottom right corner of the view) to drill down to a vmExplorer view. |
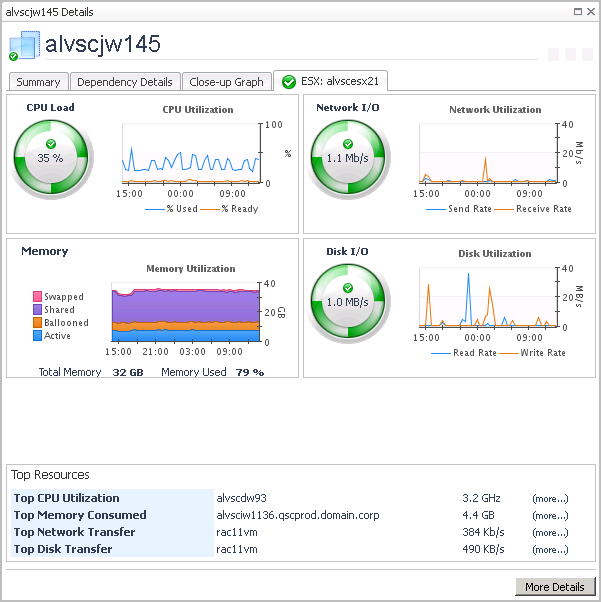
ESX Server detail view
This tab displays the CPU, Memory, Network, and Disk utilization for the <hostname> from the perspective of the ESX® server. The lower part of the tab displays the top resource consumers for this host. From this tab you can navigate to the vmExplorer dashboard by clicking More Details. This dashboard allows you to further investigate the performance of the selected ESX® host.
|
• |
Click More Details to drill down to a vmExplorer view. |