
Introducing Foglight APM
Monitoring Transactions
Investigating real user APM transactions
Investigating application server transactions
Configuring display options
Examining Response Times
Investigating response time breakdowns
Configuring Response Time Breakdown settings
Additional configuration options
Examining Error Breakdowns
Viewing Real User Activity from a Geographical Perspective
Using the SOC Transactions Tab
Exploring the SOC Transactions tab
Exploring response time breakdowns from the SOC
Configuring display options
Using the SOC for APM triage
Creating Custom Drag-and-Drop Dashboards
APM Tile and View Reference
Overview of APM tiles
Application Servers - .NET tile
Application Servers - Java tile
DB2 tile
Host tile
JMX tile
MQ tile
Oracle tile
OS tiles
Pivot tiles
Real User (APM) tile
Real User (FxM) tile
Sequence tile
SQL Server tile
Sybase tile
Synthetics tile
Virtual Hyper-V tile
VMware tile
Overview of Detail views
Application Server detail view
Host detail view
Pivot Breakdown detail view
Real User (APM) Performance detail view
Appendix: Enabling End User Transactions from FxM and FxV
Hits and Pages tabs
Response Time Breakdown tab
Application Infrastructure tab
Related Infrastructure tab
Real User (FxM) Performance detail view
Synthetic Result detail view
Synthetic User Performance detail view
Virtual Machine detail view
Topology object name reference table
Investigating response time breakdowns
|
• |
On the navigation panel, under Dashboards, click APM > Response Time Breakdown. |
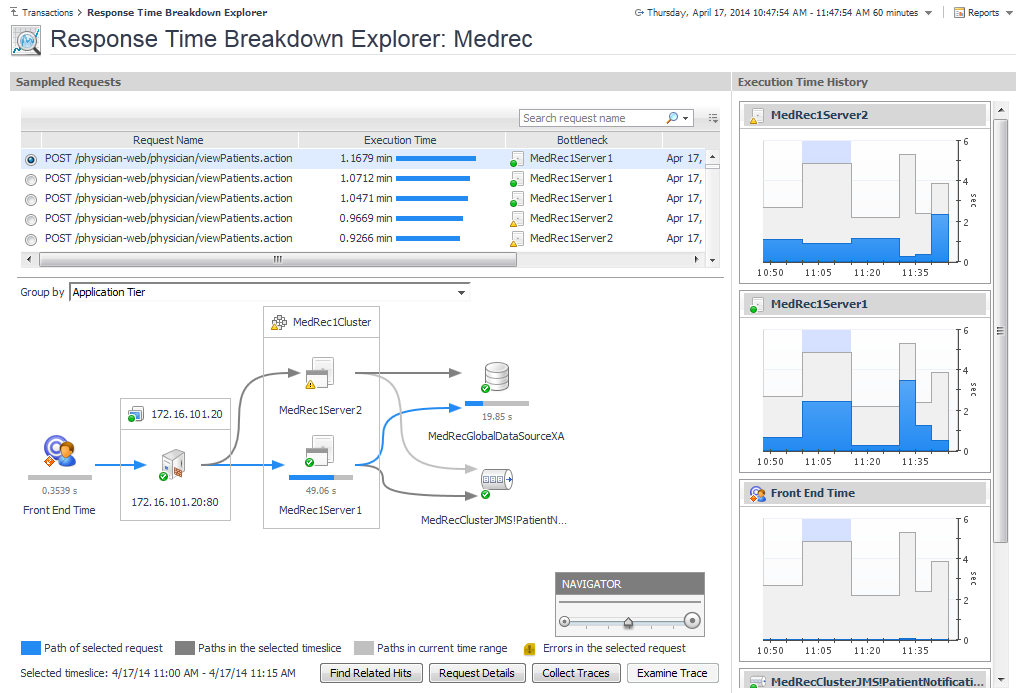
The Response Time Breakdown Explorer opens.
|
• |
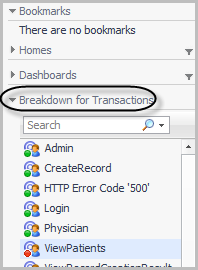
Open the navigation panel and select a transaction from the Breakdown for Transactions list. |
For more information, see the following topics:
Sampled requests
|
• |
Blue arrows mark the path of the currently selected request. For example, in the previous dashboard image, the selected request (physician-web/physician/viewPatients.action) begins at the end user (Front End Time), then passes through a web server and the MedRec1Server2 component before reaching the database. |
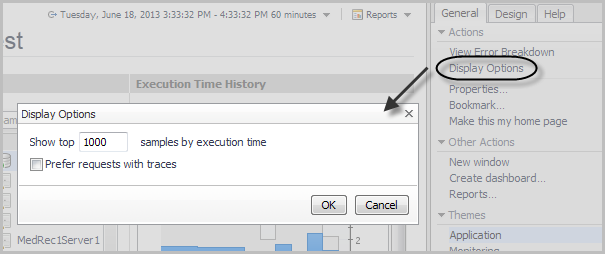
Figure 11. Display Options dialog box
|
3 |
Type a value in the Show top samples by execution time box. The default is to show the top 1000 sampled requests. Set this value to zero to show all available requests. |
|
4 |
By default the Prefer requests with traces check box is cleared. Selecting it means that requests in the time range for which traces were captured appear in the list even if there are requests without traces that have longer execution times. |
|
5 |
Click OK to save your changes. |
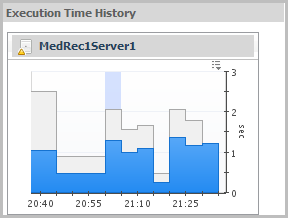
Execution Time History
Next steps
|
• |
If you are using Foglight APM Appliances, click Find Related Hits to drill down to the Search Hits page, where you can investigate pivots or map the hit. From there you can also replay the content of the hit as the affected end user saw it to determine exactly where an issue occurred. For more information about searching hits, see the Foglight APM User Guide. |
If you are using FxV, click View Transaction Replay to open the hit and session that match the selected request. From there you can replay the content of the hit as the affected end user saw it to determine exactly where an issue occurred. For more information about the Hit Inspector, see the Foglight Experience Viewer User Guide.
|
• |
To review the details of the request, including calls completed and incomplete, response time current, average, and maximum, and exceptional exits, click Request Details. The Java Requests view opens. |
|
TIP: You can also collect traces from this view (click the Action icon for the request and select Collect Traces). For more information, see Monitoring requests in the Foglight for Application Servers User Guide. |
|
• |
To collect traces for a selected request, click Collect Traces. In the Collect Traces dialog box, specify the number of traces to collect, the length of the collection period (in seconds), and whether to collect at the Full Detail instrumentation level with SQL Parameters. If you do not want Full Detail or SQL Parameters, clear the appropriate check box. |
|
TIP: For more information about instrumentation levels, see the Foglight for Java EE Technologies Installation Guide or help, and search for “Full detail instrumentation level”. |
|
• |
If you have collected traces for a request, click Examine Trace to drill down to the trace details. For more information about the Traces View, see Managing traces in the Foglight for Application Servers User Guide. |