
Formatting Shapes In Web Modeler
|
|
Please check with your Administrator that firstly, your Server and Internet Browser meet the necessary system requirements to use Web modeler. Secondly, check with your Administrator that the Web Modeler feature is enabled. |
|---|

This page explains how to format shapes in the Web Modeler online step by step.
Adding Shapes, Connecting Lines To The Diagram, and Changing Properties
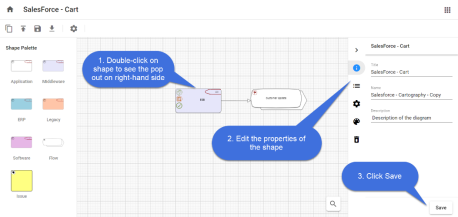
To add shapes to the diagram,
-
Drag and drop the required shape from the Shape Palette.
-
Double-click on the object shape to edit the Title and its Properties.
-
Click Save.
You can use a Connector to link two Shapes, indicating that there is a connection between the two shapes.
In-Place editing in the shape,
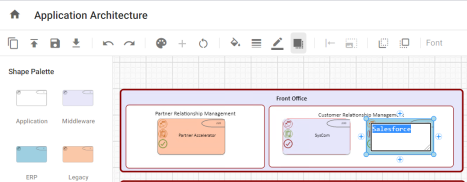
You can edit the name of a shape in the diagram editor using In-place editing.
To edit the name of the shape,
-
Select the shape you wish to edit.
-
Click again on the shape and then enter the text.
-
Either press Enter or click anywhere on the editor to finish editing.
To add the connector between the shapes,
-
Select the first shape by clicking on it.
-
Click on one of the + symbols to add the connector and move your mouse pointer to the shape you would like to connect to.
-
Click on the shape to end the selection.
-
If there are multiple connection types between these kinds of objects, you will get a menu to choose the connection that is appropriate.
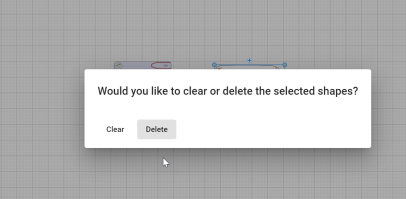
To Clear or Delete Shapes from the Diagram
Object Shapes can be Cleared or Deleted from the diagram in two ways.
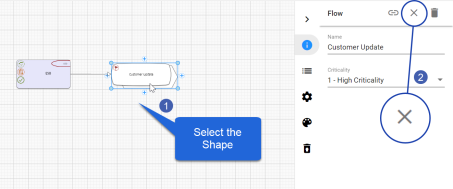
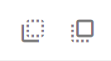
To Clear a Shape:
When you choose to Clear a shape, it removes the shape from the diagram, but it does not remove the object it represents from the model.
1. Select the shape you wish to Clear.
2. Click on 
Or
-
Select the shape you wish to Clear.
-
Press the Delete button on your computer's keyboard.
-
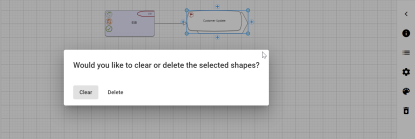
Confirm to Clear.
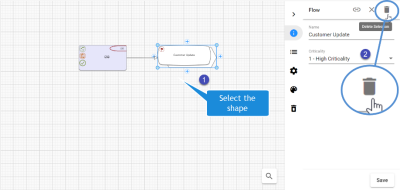
To Delete a Shape:
When you choose to Delete a shape, it removes the shape from the diagram, and when published will remove the object representing from the model too.
-
Select the shape you wish to Delete.
-
Click on
icon.
Or
-
Select the shape you wish to Delete.
-
Press the Delete button on your computer's keyboard.
-
Confirm to Delete.
|
|
If a shape is deleted, any connector associated with the object shape also gets deleted. |
|---|

|
|
When object shapes are deleted using the Delete option, it adds the item to the Trash can icon called Deleted Objects on the right-hand pane. |
|---|
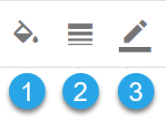
Adding Background Colors and Borders to the Shapes
Every Shape from the Palette has a definite background color, border size, and border color.
You can format the shape by
-
Background Color of the shape.
-
Border Size to the shape.
-
Border color to the shape.
|
|
Some shapes may have Region shapes and Region formatting which overrides these styles such that the style options will not work. |
|---|
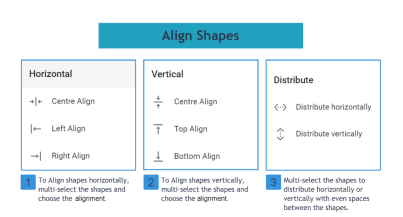
Aligning Shapes
Object shapes in the Web Modeler editor can be aligned using Align Nodes placed on the toolbar.

Object shapes can be aligned to the Left, Right, and Center horizontally, and also Top, Bottom, and Center vertically, which can also be evenly Distributed Horizontally or Vertically.
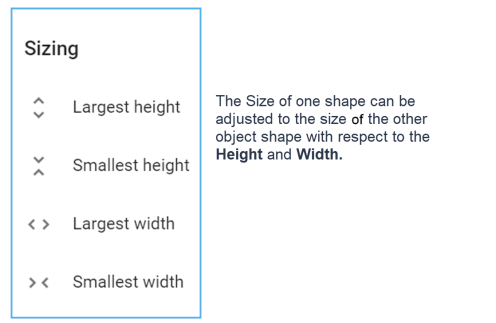
Resizing Shapes to match others
In the Web Modeler Editor, the object shape can be adjusted to the height and width of the other shape using Resize Nodes.

Move Shapes from Back and Front
In the diagram, if one shape is put on top of another, it may conceal the other.
Move To Back and Move To Front buttons help to show/Hide the object shape.
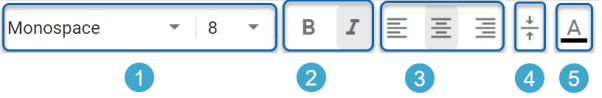
Text Formatting and Fonts
The Title of Object shapes can be formatted according to:
-
Font and its Font Size
-
Text in Bold, and Italic
-
Text alignment to Left, Center, and Right.
-
Vertical Alignment.
-
Text Color.
|
|
Some shapes may have Region shapes and Region formatting which overrides these styles such that the style options will not work. |
|---|
Gallery Manager In erwin Web Modeler
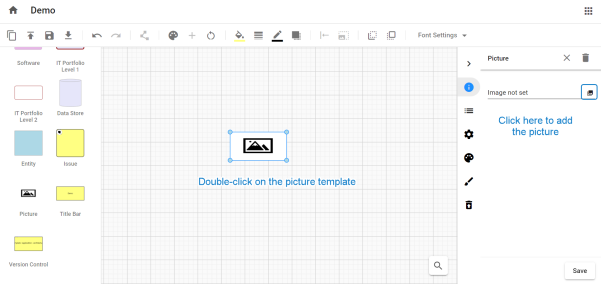
In the Diagrammer, you can upload pictures to the shape palette of the diagram and publish them.
To upload the pictures:
-
Go to the diagram template or the existing diagram to which you wish to add pictures.
-
From the shape palette, drag and drop the picture template. Double-click on it to view the properties pane on the right side.
-
Click on the
icon to open the gallery manager.
|
|
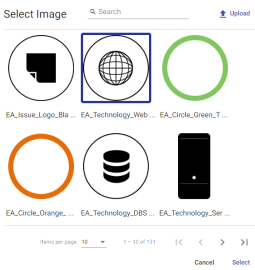
Gallery Manager displays all pictures available in the model with the most recent pictures at the top. |
|---|
-
To upload a picture, click on Upload at the top-right corner.
-
Select an image and click on Select.
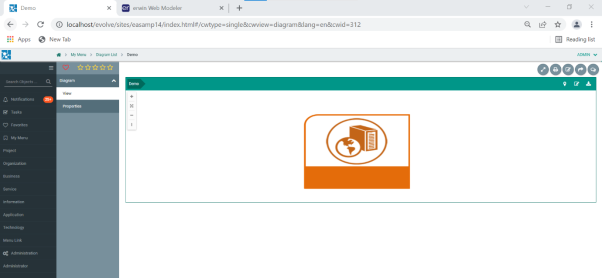
The picture appears on the draft diagram.
-
Once the draft is ready, click Publish Diagram icon.

-
After publishing the draft, picture can be viewed in erwin Evolve Web or erwin Evolve Suite.
General Operations in Web Modeler
Options that are generally available for any diagram in the canvas are:
-
Duplicate Draft
-
Publish Diagram
-
Save Diagram
-
Download Diagram
-
Undo and Redo
-
Diagram Settings
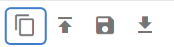
Duplicate Draft
To duplicate the working draft of the diagram, click on Duplicate Draft on the toolbar.
By doing this, a copy of the draft will be created, and you will be taken immediately to the draft diagram. It will also be available in the Web Modeler Home.
The draft diagram will be associated with the originally published diagram, and on publishing will replace the same published diagram.
|
|
To create a separate published diagram, you should duplicate the published diagram instead. |
|---|
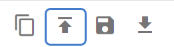
Publish Diagram
To publish the diagram, click on Publish Diagram icon on the toolbar.
Before proceeding to Publish the diagram, make sure you don’t have any incomplete items in To-Do list. Once published, the draft diagram will be deleted, and the published diagram will be available on the Evolve site and in Modeler.
Save Diagram
To save the diagram, click on Save Diagram on the toolbar.
Although drafts are continuously saved to a secondary storage, saving your draft diagram ensures it is kept in your Evolve database and can be backed up with your main database backup.
Download Diagram
To download the diagram in the form of an image to your machine, click on Download Diagram on the toolbar.
Undo and Redo
You can Undo or Redo the changes made in the diagram editor.
To apply click on Undo/Redo options on the toolbar.
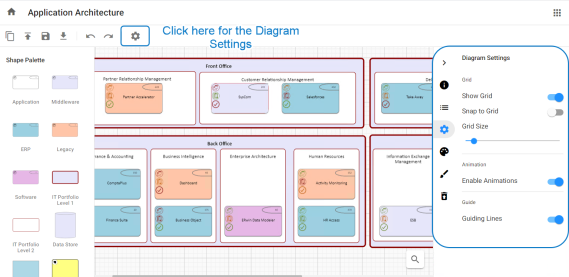
Diagram Settings
To apply the settings related to the diagram Grid, Animation and Guiding lines in the editor, click on Diagram Settings on the toolbar.
You will see a panel popped up on the right-side of the screen to work on settings.
Working with Connector Lines
The lines which associate the two objects in the diagram are called Connector Lines.
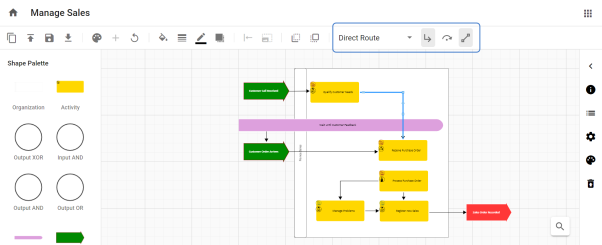
On Selecting the line, options for connector lines are shown on the toolbar.
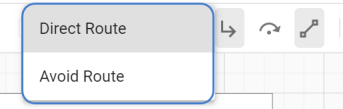
Lines can be applied in two ways:
-
Direct Route – connects the objects using the shortest path.
-
Avoid Route – connects the objects avoiding the other objects in the diagram structure.
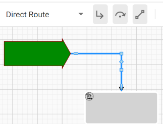
Lines are of three types are available to connect the objects:
-
Orthogonal Lines – Orthogonal Lines are when the line appears with right angles in order to connect the two objects when it cannot be drawn horizontally or vertically.
This line is available only under Direct Route and will be disabled for Avoid Route.
|
Orthogonal Off |
Orthogonal On |
|---|---|
|
|
|

-
Jump Lines – Jump Lines are when one connecting line passes over another, and it appears with an arc over it.
This button are used in conjunction with the orthogonal lines button. If an orthogonal line is off for a particular line then the jump line button is disabled.
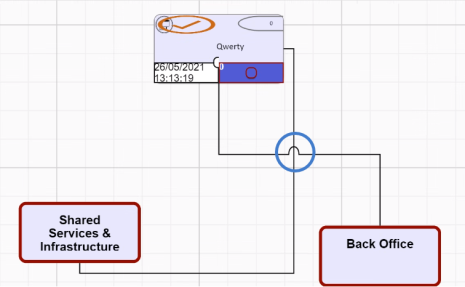
Jump is a property of an individual line, so if the lines cross and neither have the jump property then they look like straight lines passing through one another. Jump lines will be seen if both lines have jump property.
-
Lock/Unlock Link Port – Link Ports can be Locked or Unlocked. To lock them, either press the button or move the connection point (port) of the line, around the shape. When you select a location to port the line to the shape, it will become locked. If you want the diagrammer to automatically reposition the port, select the line, and press the unlock button, to release the lock.
Locking the link ports helps to keep the specific connection point when the shapes are moved around the canvas.
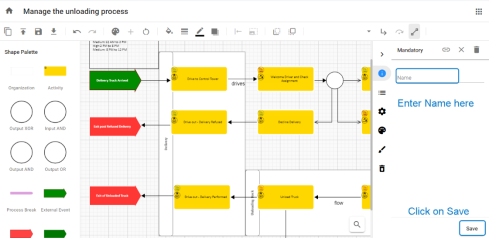
Naming on Association Links
To show the flow between the shapes, Association Names can be placed on Association Links.
To place the name on the link,
-
Double-click on Link or Connector Line you wish to add on.
-
A property panel will be opened on the right-side of the screen.
-
Enter Name and then click on Save on the bottom of the screen.
-
The Association Name can be moved around the screen by Clicking and Dragging it to a new location.
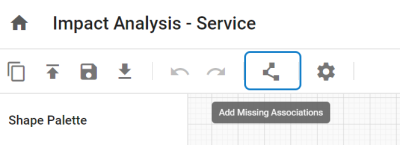
How to Add Missing Associations?
Associations between the shapes can be automatically displayed if a new object is added to the existing diagram. This will render the associations between the existing objects and the newly added objects in the existing diagram.
You can also place associations between any two or multiple objects using the button on the toolbar called Add Missing Associations.
Associations can be applied in three ways:
-
Upon Single Selection – Select any single object shape in the diagram and then click on Add Missing Association button to display the associations related to the selected object shape and the other shapes in the diagram.
-
Upon Multi Selection – Selection of any two or more shapes will render the missing associations to the objects that are already defined between them
-
No Selection – This will render all possible associations between the shapes in the diagram.