In OpenStack Explorer, on the Topology tab, that appears on the navigation panel, select an availability zone or host.
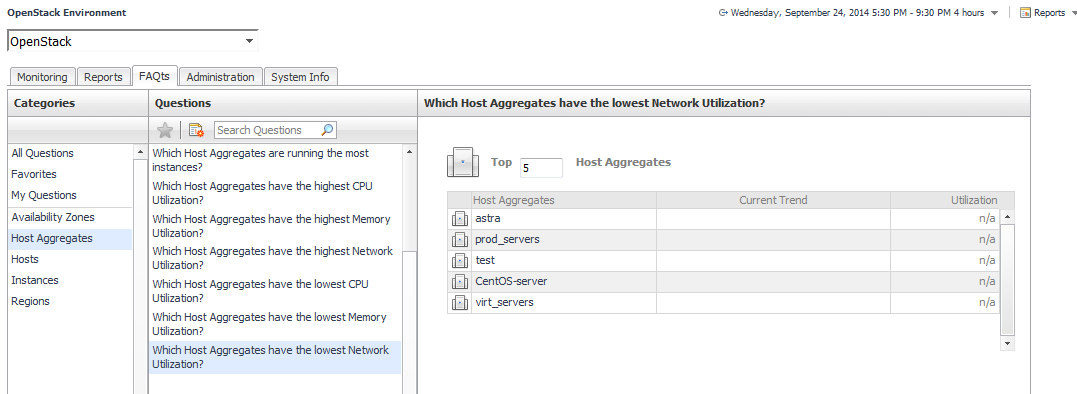
where x is the number of objects of the category you provided in the
Categories view.
Specify x by entering a number. The answer is relative to the subset of the infrastructure you are viewing in the dashboard. For example, the top five datastores are different for each individual cluster in the infrastructure.
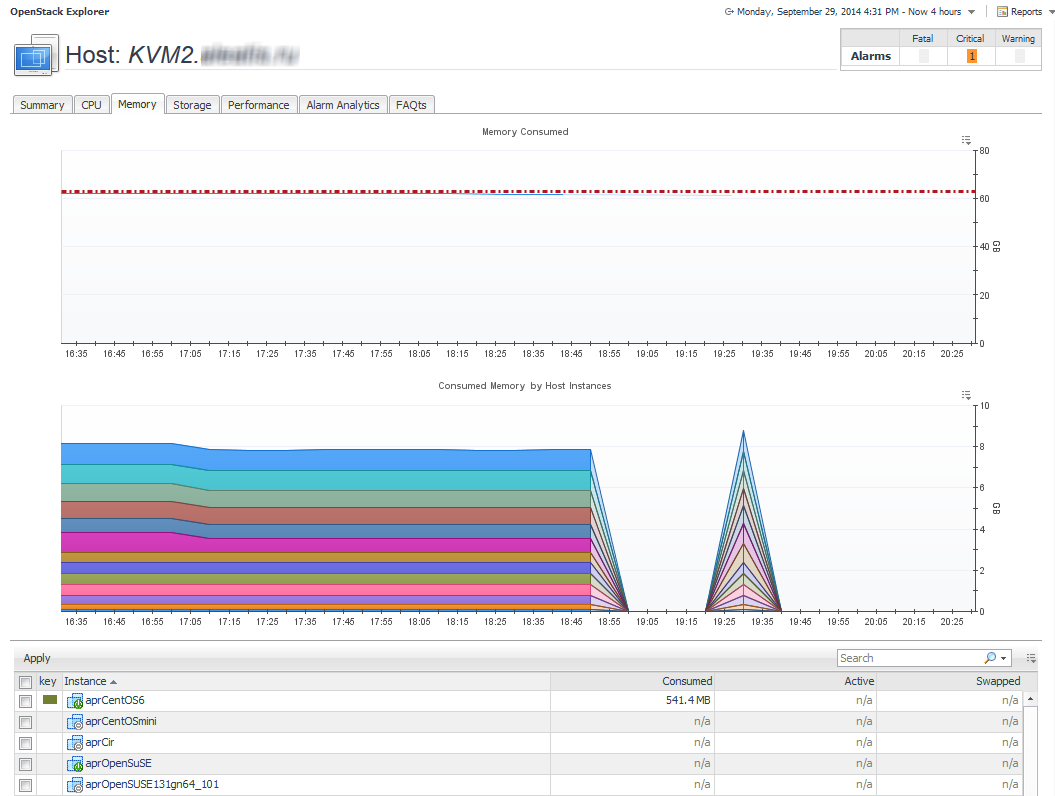
This tab is available in the OpenStack Explorer. To find it, open the OpenStack Explorer and on the Topology tab, that appears on the navigation panel, select a host instance. In the OpenStack Explorer, open the
Memory tab.
The OpenStack Explorer’s Memory tab displays the combined memory consumed for a Host, showing the amount of memory each Instance that is running on that Host uses.